The Grading for Equity Twitter chat is tonight at 8pm EST, although some West Coasters have been coming in later and taking part somewhat asynchronously -- there are no late penalties in this chat! This week, we will be continuing the discussion of biased grading practices with chapter 10: Practices That Value Knowledge, Not Environment or Behaviour (continued)... aka the Homework chapter. Please feel free to join in the discussion! Here are this week's questions:
What, in your opinion, is the purpose of homework, especially in physics or science classes?
Think about students in your class who routinely do not complete homework. What sorts of things might be stopping students from getting homework done?
How do you count homework in your current grading practices? If a student does not complete homework, what is at stake for them?
Feldman argues that we actually encourage cheating by giving points for homework; b/c students know they'll be penalized for not doing it, copying seems a reasonable strategy. Have you seen this to be true? How can we avoid inadvertently encouraging cheating?
How might we support our vulnerable students - those who need more time to do homework or those who have fewer supports and resources outside the school - and who most need the practice that homework is designed to provide?
Incidentally, in one of his questions at the end of the chapter, Feldman suggests comparing marks/grades of a class with and without homework and participating categories. I've done something similar to this (with quizzes & looking at different weights for assignments, eg, since I've never "counted" homework or participation), and it can be eye-opening. Highly recommended.
Last week's chat is archived in this Wakelet You can access all the past chats from the resources section. See you tonight!
This week the Grading for Equity Twitter chat (8pm EST) will be examining biased grading practices with chapter 9: Practices That Value Knowledge, Not Environment or Behaviour. Please feel free to join in the discussion! Here are this week's questions:
What sorts of activities do you award extra credit for, if any? If there are things you routinely offer extra credit for, why have you not made those activities required parts of your curriculum?
What is your policy for late work? Do you deduct points? How might you reevaluate your late work policy to give students time to learn and master content?
When students cheat, do they get an automatic zero for a grade? Is this the best punishment for cheating? Are they made to re-do the assignment on their own? What else might work to rehabilitate student learners?
”Some consider cheating on an assessment ... as a signal that though she is struggling, she is still engaged and cares about her success.” Do you agree? Could cheating be a sign of greater engagement than if a student simply skipped the assessment?
Which student behaviours do you grade? How can students be taught how participation and effort are means for learning, not ends in themselves?
Last week's chat is archived here. You can access all the past chats from the resources section. See you tonight!
This week the Grading for Equity Twitter chat will be digging deeper into chapter 8: Practices that are Mathematically Accurate (continued). Here are the original questions (the twitter versions will be edited somewhat for space):
Do give students a grade “bump” when they have shown improvement or growth over a term? By allowing (and encouraging) students to demonstrate growth over time through improved performance, and recording that most recent performance, do we still need to include a bump, or does the improved score itself recognize and reward growth?
How easy should it be for a student to be able to calculate her own grade? Does the traditional “average” method allow for this? Would standards-based-grading allow for this?
In physics & science, we necessarily do a lot of group work (e.g. labs, presentations, etc.) What is your current strategy for group grades? Does it align with the Grading for Equity pillars? If not, how could you make it do so?
Think of an example in the professional workplace in which group work (or more likely, called “collaboration”) is expected. What is the rationale, and how is the effectiveness of that collaboration determined? How could we apply this to grading?
What are your main takeaways from the past two chapters on mathematically accurate grading practices? What changes so far, if any, will you make to your grading system?
Last week's chat is archived here. You can access all the past chats from the resources section. See you tonight!
This week in the Grading for Equity Twitter chat, we are finally digging in to the meat of the book. We'll slow down a bit; fewer questions and only one chapter per week.
This week, we are looking at chapter 7: Practices that are Mathematically Accurate.
What grading scale do you currently use? What are your thoughts about it now that you’ve read this chapter?
If you’ve assigned a zero, was it intended primarily to affect students mathematically or psychologically? Knowing that it is mathematically unsound and demotivating as well as inaccurate, does that change your opinion of it?
Did you have any particular light bulb moments while reading this chapter?
What other ideas in this chapter would you like to discuss? Do you have any concerns?
Last week's chat is archived here. You can access all the past chats from the resources section. See you tonight!
The Grading for Equity Twitter bookclub continues apace. Last week we studied chapters 3 &4, which introduced us to the problems in our current grading schemes.
That was pretty eye-opening. I always think my 'system' is fair, but if you're juggling 7 different systems, it really doesn't matter. I wish my school would agree to agree on some things, even if it isn't my first choice.#Grade4EqChat
I'm thinking of a line of best fit. We are supposed to look at most recent, most consistent marks (which can be interesting in grade 9/10 sci -- bio/chem/phys/earth&space cafeteria course), but at least it allows us to "ignore" outliers. #Grade4EqChat
This week we will be looking at chapters 5 & 6, continuing with The Case for Change and A New Vision for Grading. Feel free to join in, even if you haven't read the book! Here are the questions:
Are students motivated to achieve success or to avoid failure? What specific actions, policies, or words by teachers cause students to experience one type of motivation instead of the other?
Do you think of your tasks at work as performance or mastery goals? What affects how you define the goal? How does this affect how you pursue the task?
In what ways do schools and classrooms send a message of competition for achievement? How does your school's treatment of awards and honors promote or undermine a growth or fixed mindset?
Review your classroom's current grading policies through the pillars of our vision: How accurate are they? How bias-resistant? How motivating?
How much does this book's vision for equitable grading match against your school's overall vision? How likely is it that your school community could agree on this vision?
How much does this book's vision for equitable grading align with your own, personal vision for grading? What concerns do you have about this vision? What are your hopes?
Last week's Twitter chat went really well. Please join in, even if you haven't read the book or aren't a physics teacher! I've archived the tweets, and you will always be able to find them on my Resources page.
We had a great discussion about some of our philosophy and current grading practices.
Part of my 1st day speech is to tell them they will do work I will not grade but I promise not to make it busy work, that I will have purpose behind what we are doing and they can always ask me why. I should be able to tell them why (if they can't tell) or I shouldn't assign it.
— Bree BarnettDreyfuss (@BarnettDreyfuss) July 27, 2021
It does require a change in the process, but I've found that the culture of the class is so much more positive. This is worth our time. #Grade4EqChat
This week we will be looking at Chapters 3 & 4, which focus on why we should be changing our grading practices. Here are the questions we'll be answering:
Thinking about how others have responded to your mistakes: How have helpful responses impacted you and your effectiveness? How have unhelpful responses impacted you and your effectiveness?
Recall something you learned to do outside of the school context. What motivated you to learn and to continue learning when you struggled?
How effective are the use of points for students who are the least motivated and engaged? How might the use of points—the addition and subtraction throughout a student's day—affect those students' relationships with adults and their self-concept about whether school is “for” them?
What confidence or uncertainty do you have that two teachers in your school would assign the same grade to a student?
Are there teachers with reputations as “hard” or “easy” graders? What, specifically, defines them as that? How does this categorization make you feel? How does it make that teacher feel? How do students react?
See you tonight! The rest of the schedule is posted at this tweet.
Several of the physics PD sessions I've attended this summer have mentioned Grading for Equity by Joe Feldman, and how much we'd like to have a discussion about it. So, in the interest of pushing myself well outside my comfort zone, I'm hosting a weekly Twitter chat. It will no doubt have a physics education slant to it, but all educators are welcome to participate, even if you haven't read the book.
The chat will be on Mondays from 8-9 pm EST until October 4. The current plan is to look at 2 chapters per week to begin with, moving to 1 chapter per week for part III. We'll use the questions at the end of each chapter as a starting point for discussion.
I'll post, from my Twitter profile, a new question about every 10-15 minutes or so. We use the Q# / A# format. Remember to include #Grade4EqChat somewhere in your tweet so others will find it.
TDSB teachers can access the book and in print through the Virtual Library. For Ontario teachers, it is available online through the OCT library. For teachers elsewhere, check and see if it is available through your board or district or professional organization.
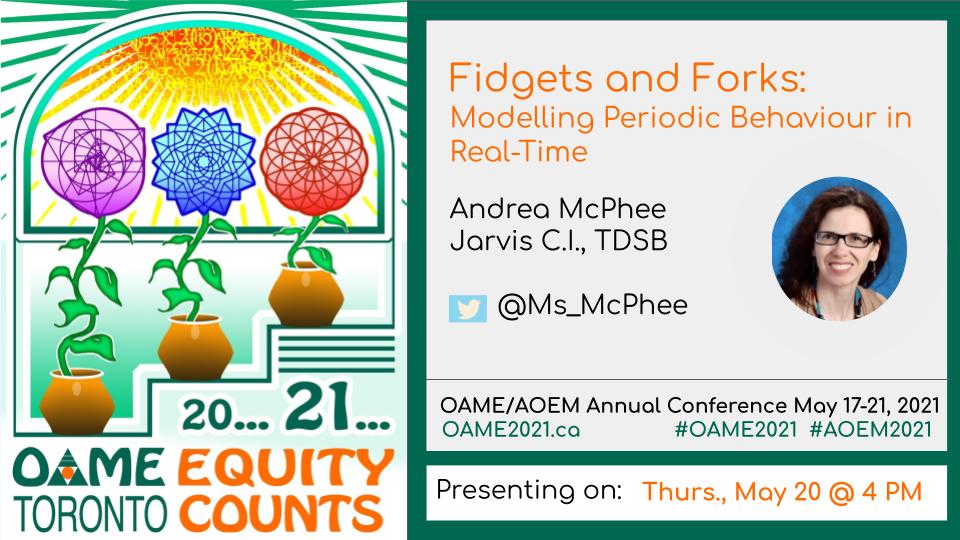
OAME 2021 is completely virtual this year, and I'm excited to be presenting two sessions. The pre-recorded session will be a version of Rope-a-Slope: Inquiry in Grade 9 Math, updated to work for face-to-face, socially distanced, and virtual learning. Despite being pre-recorded, it will still be asynchronously interactive should you wish to play along at home, and there will be a Google doc to post questions afterwards. The recording will be available Wednesday, May 19 at 1 pm EST until June 11.
The live session is Fidgets and Forks: Modelling Periodic Motion in Real Time for grades 11-12 math. Come and play with fidget spinner data, tuning fork data, heart beats, pendulums, and how to get students to capture their own data. If you can't make the date of Thursday, May 20 at 4 pm EST (or any of the other live sessions), the session will be recorded and the recording will be available until June 11.
Register now! (Or check with your principal to see if your school has a group code.)
If there is one positive thing that has come from this pandemic and the sudden switch to everything virtual, it's that there is a literal world of online PD available out there, and you can roll out of bed and attend it in your pjs. With a cat on your lap or not, as it happens.
Currently it seems like all the PD is happening at the same time. This week, in fact.
That's four conferences in one week. I'm going to be busy!
This current spate of PD (or CPD as some call it) actually started this past Saturday with the Seneca Virtual Science Conference. Seneca is a free UK homework and revision platform, and they have been offering free, short but packed conferences in all subjects, as well as pd for online teaching and free courses for teachers in things like metacognition, literacy, etc. You can check out the recorded science webinar and presentation resources at the link above.
And yes, I had to get up at 3:45 am to attend. But it was over by breakfast time!
They are also hosting some post-conference Twitter chats this week at 7:30 pm BST. #senecaCPD
Join me at 7.30 for our first in the series of #senecacpd chat this week.
30 minutes, 3 questions to get the conversation going around all things
Three of the virtual conferences focus on tech or general pedagogy; scroll down if you're just interested in physics.
The free FlipTech 2020 conference actually started yesterday and continues until Thursday. What I'm liking about this conference is that they are actually flipping it. You can hop in at any point; watch the videos/presentations before hand, then join the speakers for a live Q&A Zoom. The Zoom meetings are being recorded, so you can catch up if you miss something. Follow #FlipTech2020 for details and updates.
ISTE is hosting a 3-week Summer Learning Academy starting today until the end of July, although you will be able to access the materials until October. It's only $US 20 (more if you want the yearly membership which gives you access to more courses). This academy is specifically focussed on online learning, which seems somewhat appropriate these days. There are daily webinars and 4 microcourses which you can work on at any time -- convenient if you happen to have filled up your schedule with other online PD! The schedule is here.
I'm really pleased to be attending the 2020 United EdTech Conference this Friday and Saturday, which will be elevating BIPOC voices and examining best pedagogical practices for using edtech. The days will be short and sweet, with a 90-minute Pedagogy in Practice session followed by a 30-minute Lunch and Learn session. The webinars will be recorded and made available, which is great since there are too many good options and we can only pick one each day. Fortunately, some of the lunch and learn sessions will be repeated on day 2. The $US 10 fee will be donated to The Learning Laboratory New Orleans.
Yes, the FOMO is real.
I've been following the UK Institute of Physics for a while, envious of all the teacher PD they provide. They've had to move a lot of their PD online and it's been fantastic. Attending the South Region 3-day event at the beginning of July meant more 3:30 wake-up calls, but it was worth it. (And let's face it: rolling out of bed, making a cup of tea, and getting to the presentation in 15 minutes is a practice I don't really mind repeating.) I've been attending scattered workshops as well, and am on the lookout for the next Power of Per workshop since I couldn't attend last Thursday. The North West region is having their 3 days starting this Thursday until Saturday.
As for how to attend more than one workshop at once? Even with an extra Chromebook, that might be a bit much, but I'll figure it out.
TDSB Google Camp 6.0 is next Saturday. It's sold out, naturally, but if you are lucky enough to go, I'll be presenting three sessions in room 218.
Session 1 is an updated and expanded version of Taking Math Digital with Desmos, Geogebra, and Equatio. Come explore tools that can make investigation in math, science, and STEM easy and fun. The Desmos graphing calculator, in particular the activity builder and activities such as Card Sort, Polygraph, and Marbleslides, is a valuable tool that makes helping students explore math concepts easy and interactive. Geogebra is a GSuite and user-friendly version of Geometer's Sketchpad. We will also talk about the updates to the Chrome extension EquatIO, helps write your math using predictive text, handwriting, and speech input, not to mention integration across all GSuite platforms.
In session 2, I will be giving an updated version of Flipping the Learning. This session will show you what a flipped lesson looks like, and how I am currently integrating flipped lessons into my math and physics classes. We will discuss the pros and cons, how it can be used for differentiated learning, and how to increase buy-in. In addition, we will discuss the technical aspects of flipping, specifically the specialized flipping platform EDpuzzle (but you can keep it as simple as YouTube and Google Forms). If you watch the video ahead of time, you will get the opportunity to delve deeper into some of the nifty features of EdPuzzle and have your first curated video ready for Monday's class!
In session 4, I'll be presenting How Random! Infinite Possibilities Using Sheets, which will talk about how to make the randomized practice sheets that are my pride and joy. Sheets is useful for so much more than just accounting and graphs! Learn how the random number functions can be used to automagically create vocabulary lists, math problems, matching exercises, and yes, graphs... the possibilities are quite literally endless. Want to create a random question of the day? Sheets! Want the answer key, too? Sheets! Even better, you can link them to other GSuite products such as Docs, Slides, or Drawings to make collaboration easy. Sample templates will be provided so you can have a finished product ready to go for Monday's class.
It'll be a busy day, with lots of great workshops to choose from. If you can't make it to one of mine, I'll put links to the resources.
I'm writing this on the train back from the OAPT conference hosted at the University of Western Ontario, and it was, of course, amazing. I have so many thoughts and new great ideas to put into practice. Some quick takeaways:
thinking about using improv techniques in class to overcome my (and students') implicit bias, especially "Yes, and?"
"We use mathematics to help us make the physics more precise."
"Just because I don't have a 'math brain' doesn't mean I don't have something useful to contribute."
"You're not part of a group, you're part of a team."
Yes, the students do really need to draw a picture
Why haven't we been using the rotunda at Jarvis to make super-long pendula?
I think I'm going to have to wait until June to do the write-up justice. I will share my presentation on Tweaking the Traditional Lab below; a link to various files and resources is posted in the resources section of this blog.
(Incidentally, one of the things I always like to mention when I'm introducing myself at presentations is how amazing the PD is on Twitter. The chart on the first slide is a perfect example. Elizabeth Houwen (a math teacher, incidentally) posted it last June, and I thought it would be a great way to get the students to practice unit conversions as well as estimation, and we also got a nice little lab out of it and an anchor chart so they have "reasonable" speeds to compare their answers to. All from one small tweet!)
***
I've been busy converting my drill sheets practice sheets, which I mentioned in my last post) into Google sheets, as well as creating new ones. I'm fairly proud of the chemical nomenclature one (in part because I just found out how to write superscript and subscript numbers in Sheets, so the clunky ^3 _4 notation is mostly gone), but I really want to share the electromagnetic right-hand rules ones.
I made these using the =image() function, which allows you to put an image directly into a cell (and not just overlay the image on top). Unfortunately, you can't use the shared url of images on your Google drive (which is odd and annoying).
I'll probably refine the mixed version so that it's a little more clear what you need to find in each question; I'm not sure a student would recognize immediately that they need to find the direction of the action of the magnet for 1 and the location of the north pole for 6.
You can find these and a lot more randomized practice sheets at my course website; click on the practice sheets link under Resources.
Incidentally, sometime between last December and April, Google changed the formatting of "publish to pdf" for Sheets so that it's landscape instead of portrait. There doesn't seem to be a way to modify this, and it's really mucked up my formatting. Everything is spread over two pages, and don't get me started about what it did to my spectroscopy sheets.
There are some fantastic PD opportunities coming up in the next few weeks.
Google Camp 5.0 will be on November 4; sadly it has already sold out, but you can put your name on the waiting list and some of the sessions will be simulcast on Twitter. I'm thrilled to be joining some amazing speakers; I'll be presenting a follow-up session to my Flipping Your Classroom session from March -- I'm going to try modelling a flipped lesson! There will be pre-session homework (if you so choose)! I'm very excited to be talking about EquatIO and Desmos, which are two really amazing ways to take math and STEM digital. As usual during the day there will be a room with helpful helpers available if you've been running into difficulties with GAFE and need someone to walk you through the solution.
The TDSB's Renewing Math Summit on the Friday, December 1 PD day is offered to secondary teachers. The focus is on Teaching/Leading in an Equitable Classroom and 21st Century Global Competencies. I'll be giving a session called Rope-a-Slope: Inquiry in Grade 9 Math where a simple piece of rope and a measuring tape and guided inquiry can lead to learning about relationships between variables, slope, direct and indirect variation, and more. The other sessions look amazing as well -- I'd love to be able to attend them all. There might also be a drop-in room to learn more about digital math tools like Knowledgehook, Desmos, Geogebra, etc.
Registration for TDSB secondary teachers is on K2L until November 23, or they reach capacity.
Note: Google Camp 5.0 will be Saturday, Nov. 4. Registration is open for TDSB teachers on K2L. This event always sells out, so register soon! If you're interested in presenting, submissions are open until Monday, Oct. 2. The TDSB's Renewing Math Summit will be Friday, Dec. 1; you can still submit a proposal until Sept. 30. Yes, that's today. Hurry!
When I did my physics honours specialist with John Caranci way back when, he told us that one of the easiest ways to become a great teacher is to try or adopt one new technique per month. Well, I'm still working on that (I probably average 3-4 a year), but this year I'm going to really make the effort to try them several times per month.
I've already made the first change by getting the students used to grouped tables -- a bit challenging in one of my classrooms which has fixed benches, but I'm trying to make it work -- and I started my October technique a bit early because I couldn't wait.
I was inspired by this blog post by Sara Van Der Werf to try a Stand and Talk with my grade 11 mixed math students last week. To summarize, the old-style "share with your neighbour/elbow-partner/TPS" doesn't really work most of the time. Sara has found that getting the students to stand up and walk across the room to talk to another person and giving each pair a paper with something to look at with the instruction "notice 10/20/50 things about this" really increases student engagement. Her post is excellent, with specific instructions on how to make it successful and a lot of math examples to use.
(By the way, the link to the "rumors" group learning routine at the end of Sara's blog post would be great for the prediction part of POE or for review.)
I thought mapping diagrams would be a good place to try this. We'd looked at domain and range and function/NAF. I prepared this picture for them to look at and notice at least 10 things (yes, it's supposed to be a big number).
This is my revised version
Did it work? Mostly. I wound up grabbing the wrong folder and left the students' copies of the diagrams in my office, but I did put them up on the screen. Not ideal, because on my original version the arrow heads were not as obvious and I used too small a font for the sets of points and the labels, so they were a bit hard to read from the back of the room. There was a bit of "I don't know what she wants, do you know what she wants?" at the beginning, but after I encouraged them to go for the obvious first and used Sara's prompts ("I should see you pointing," "What do you wonder?" "Everything on the screen is there for a reason. What else to you notice?"), I heard some good discussions. And once we were talking as a class, I had volunteered suggestions right away instead of the usual silence.
Some of the suggestions:
there are circles on the page
there are numbers in the circles
the numbers go from negative to positive in both of the left circles
there are no negative numbers in the right circles
the numbers go in order
there are 4 numbers in one left circle and 3 in the other
both right circles have 3 numbers
I was a bit surprised that nobody mentioned the arrows, but that could be because the arrow heads wee small and didn't really register, but when I pointed out that there were arrows, more suggestions came in thick and fast:
an arrow goes from the -3 to the 3
another arrow goes from the -2 to the 1 (etc)
two arrows go to the 3 in both right circles
there are two arrows going from the -1 in one circle, but all the rest have only one arrow
Nobody noticed the connection to the coordinate pairs above the diagrams, but I think that is because the font was too small and they didn't really notice it. Once I asked "do you see a -3 anywhere else on the page?" the penny dropped.
Oh! The arrow goes from -3 to 3, and there's a -3 and 3 together above.
Same with the -2 and 1.
That first circle is all the first numbers and the second is all the second numbers
At this point I switched to Socratic questioning, and we established that the left circles were the x's, or domain, and the right circles were the y's, or range; none of the numbers were repeated and were in order from most negative to most positive; that one was a function and the other wasn't; and that you could tell whether it was a function or not by the number of arrows coming from each of the points in the domain. I then told them these were called mapping diagrams and had them create some from sets of points.
We stood the whole time we did this, and nobody complained. This was very surprising to me because there are a few students in that class who complain as a matter of principle, but who were actually mostly engaged in the activity and even offered a suggestion or two.
So will I be using stand and talks again? You bet. I'm already scheming my next picture. I love the way I could work concept attainment* into the notice and wonder. I need to make I also focus on the "what do you wonder" questions. The diagrams do require a bit of thought first, so I'm aiming to do two per month in my math classes to begin with and work up to once a week in all classes. I'm already planning on trying this as a way to introduce B-R diagrams, chemical formulas, and circuit diagrams later on in grade 9 science; and more immediately, rational vs irrational numbers, polynomials, like vs unlike terms in grade 9 math; standing waves in physics; and different forms of the quadratic function in the mixed math. That will do to start with, I think!
*I did my math honours specialist final project on concept attainment, and I keep meaning to work it into lessons whenever I can. Perhaps I'll do a blog post about it so I will remember to use it.
Last year while on leave I had the opportunity to watch a live webinar with Eric Mazur on assessment as a silent killer of learning, and I got really excited by one of the ideas he presented. Here's a video of that same lecture; the pertinent section starts at around 41 m 44 s and it's only about 6 minutes long. I recommend watching the whole video some time.
I love this idea. It's like test corrections, but without my having to grade the test first. Because of the nature of the test, the question level should be such that it should be difficult for any one student to get 80% by themselves. Lots of higher-order thinking skills, not so much of the recall.
I was hoping to try this method out with my pre-AP physics class several times this year, but I only got a chance to do it once right at the end in the electromagnetism unit. I opted to go the scratch card route, since coding a trouble-free non-mc group test would take more time and energy than I usually have in May and I also already have a nice bunch of conceptual mc questions (plus some shamelessly pulled from previous OAPT physics contests for extra oomph).
My test was 15 questions long. The students sat around trapezoidal tables in groups of 3-4 more or less based on their (self-chosen) lab groups -- the class is pretty homogeneous so that worked out fairly well grade-wise. I gave them 25 minutes to solve the questions on their own, then put the scratch cards on the tables. I also gave them individual white boards and let them use the blackboards if they wished. [One of my students is mute, and since I didn't let them use their phones, having a personal whiteboard for communicating was crucial.] They had the rest of the period (45 minutes) to redo the test as a group. Difficulty-wise, I tried to err on the side of the test being too easy since it was our first try (and I always tend to think questions are too easy when in reality, not so much).
I have to say, it was a lot of fun to watch. There was cheering. There were groans of agony. Most importantly, there was immediate feedback and learning... and I didn't have to mark it myself. Marks-wise, we went from high 50s to mid-90s, with most marks in the 70s. The marks are a bit lower than this class is used to, but I'm putting that down to it being the last test of the year and having rushed through teaching some of the material. I wound up just adding their individual marks to the group marks and making the whole thing out of 70 (one of the questions was a bit too confusing, so I made it a bonus).
Weirdly, not many of them used the whiteboards. I need to get the students using the whiteboards early and often in class so they are used to thinking things through visually.
I wish I had done this for the post-friction lab quiz. I am thinking that I will adopt this for the multiple-choice sections of future tests; since I'm considering moving to standards-based grading for the calculations/written explanations, I might get the best of both worlds.
On to the slightly more crafty section of the post.
I used 4x6" matte photo cards because I have a huge number of them at home, but you could probably use construction or even regular paper. There is also the online IF-AT test maker, but that is geared towards (very) large groups (minimum 125 cards). To send the cards through the "no, I really only want to print on letter-sized paper and maybe legal if you really insist" school laser printer, I used loops of masking tape to tape the wrong side of the photo card to a scrap piece of letter-sized paper and send it through. Using masking tape is important because it doesn't form an immediate permanent bond like clear tape does; you're less likely to tear the card when you remove it. Painter's tape would be even better for this. I had to experiment to see which side tore less.
Once you've printed your cards and answered them (I used a red checkmark), you make them into scratch cards. How to DIY: some quick Googling brought me to this site. Essentially, you need some clear tape, acrylic paint, dish soap, and a brush.
You tape over the bubbles, then mix 2 parts paint to 1 part dish soap, and apply. Ideally, you'd apply thin coats so you don't get a lumpy paint job, but frankly the bubbles are so small I don't think it matters. I started by using gold paint but it was taking too long to become opaque -- I got up to 5 coats on my tester cards and you could still see through the paint (on both sides if you held it up to the light), although it's possible I originally had too high a ratio of soap to paint. I added a large dollop of grey paint and presto! I only needed 2 coats to cover my bubbles.
You could make a stencil if you wanted to get really finicky and avoid overpainting; I just scraped off the worst of the excess paint where I could.
I also made scratching tools by cutting up an old plastic membership card. The flat edge was pretty much the size of a bubble, so they wouldn't "accidentally" scratch off part of the wrong bubble. The kids loved scratching off the answers; this would be fun to do as a vocabulary lottery card-type thing or a fun take on a homework pass. And it's reusable!
I'm also going to explore doing this as a computer exercise because multiple choice is great for conceptual questions, but a bit of a pain for calculation exercises. I like that in Mazur's version, the group members' answers come up and that's what they discuss. I'm sure Mazur got someone to code specialty software, but I think it could be done with GAFE tools using a combination of Forms, Sheets, my self-grading quiz tutorial, and the FormRanger add-on. The one difficulty I see is getting the students to write exactly what I put in as an answer, and how to let them know that they need to fix a small issue (say, sig figs or direction) as opposed to having completely the wrong answer.
What other ways could we use scratch cards (physical or computer-based) in class?
PD on a Saturday? Yes, please, especially if it's Google Camp. Yeah, yeah, fangirl, whatever. There's always so much I learn, even when I don't quite make it to the sessions I wanted to.
The day started with an excellent keynote by Jesse Brown (yes, thatJesse Brown) about how to take advantage of disruption. His biggest point for me was, of course, fail. Building failure into the model is also a feature of the growth mindset, which I'm still struggling to bring to many of my students.
Speaking of failures, I utterly failed to go to any sessions because I decided at the last minute that my presentations needed gifs (and why can't I stop typing figs every time?), but I've been creeping everyone's Slides ever since. There are terrific resources there; you should check them out.
I'll end by including the slidedecks (and a how-to video) for my presentations, but one of the things I find when I'm preparing for presentations like this is that I always learn new things. For instance, while preparing for my first session -- which was about how to make a self-marking, non-multiple choice quiz that gives immediate feedback -- I discovered that I need to revise my previous blog posts, and specifically my comments about what query() does (because it doesn't do what I thought it did, for the most part) and because I also learned about arrayformula(). Always learning!
My second session was about tools and tips for flipping lessons. The most important take-away from this presentation, I think, is "What is the best use of face-to-face time with students?"
Part of my session shills for EDpuzzle, which if you remember I learned about at STAO in November. Since then I've jumped in with both feet and lately, I've been plaguing them with suggestions for new features.
What did I learn through prepping for this presentation? I reread Flipped Learning by Bergmann and Sams and remembered the post-video reflection forms one of the teachers uses. I had let those go by the wayside since using EDpuzzle in favour of embedded quizzes, but I think I will start reintroducing two/three-question reflection forms as exit cards.
The gist of this step is that adding a new line to the top of a course's "hw to calendar" Sheet triggers a script that turns the info into a Calendar entry. (This is why the tweets are listed in order of date+time tweeted and not the due date.)
There is probably a way to do this from within the master "Tweets by @Ms_McPhee" Sheet, but when I was setting this up last summer, I couldn't find anything straightforward apart from this script I grabbed from a blog post (which I've lost the link to, so thank you anonymous blogger for your help). I know just enough about coding to add to someone else's code, so it may be clunky, but it works.
When I was testing this last summer, I had no difficulties. Naturally when school started and I was tweeting in earnest, a couple of strange little bugs appeared. Namely, each time the Sheet changed the script ran twice and I got two identical Calendar entries. Also, any time I tweeted anything, homework or not, or was retweeted, or was even mentioned in a tweet, it "changed" the Sheet (even if there was no actual change to the content), triggering the script. Twice. Which created more identical calendar entries. Sometimes I would have upward of 12 identical homework (or even worse, test!) entries on one day. Some of the students were a little startled, and I was spending far too much time in Calendar deleting superfluous entries.
To solve the second problem, I threw in a validation process. You'll need to add the following formula to cell M1:
=COUNTUNIQUE(C:C)
N1 also has a number in it, added by the script; you should leave it blank to begin with. The script now checks the number of essentially non-blank (or unique) rows and compares it to the number in N1. If N1 is less than the number of rows (meaning we've just added new homework information to the Sheet), it will run the calendar function and set the number in N1 to the number of rows. Otherwise, it's a fake "update" and the script can ignore it. It works well; now I can participate in Twitter chats without stressing out my students in the Calendar. The only thing I have watch is when I tweet out similar homework for different sections of a course to make them slightly different; usually all I need to do is change a punctuation mark.
I haven't worked out what's going on with the double posting, though. It now seems to be happening more or less randomly.
Here's how to get the script running. From the Tools menu, select "Script editor."
A new window will open. Delete the older code, and copy the code below in its place . it's a wee bit long, because my rule is to never delete anything but instead comment it out in case I want to use it later. I grabbed most of this from the internet; the main thing I added is the row counter business.
I'll explain what a few of the lines do. In general, a // in front turns the rest of the line into a comment and a semi-colon finishes an instruction.
Row 4 tells the script which calendar to use. To get the calendar id, click on the triangle next to the desired calendar and choose Calendar settings.
Scroll down to where it says Calendar Address. It's the code next to "Calendar ID," oddly enough. Copy that into the space between the quotes.
Rows 8-22 say which columns contain which pieces of information is in. It's a letter-to-number cipher, so A=1, B=2, etc.The start date is in column 1(A), the title in 2(B), the description in 3(C), the row counting cells are in 13 & 14 (M & N).
Rows 24-55 are the main script function, getLatestAndSubmitToCalendar, which is pretty much what it says on the tin.
Rows 26-32 get information about the sheet, including the number of rows (which I don't think I need, but they were in the original script and so I left them. I'm not sure why). The original script took the information from the last row of the sheet, but importrange() turns that into a bottomless pit, which is why I reverse sort them.
Rows 34-47 get the actual date, title, description, and row-counting information from the Sheet.
Rows 50-55 run the createEvent script only if a new row has been added to the Sheet, and updates N1 to match the number of rows so a new calendar event won't be created if some other "change" is made to the Sheet.
Rows 57-70 are the createEvent function, which actually creates the Calendar entry. This is pretty straightforward. I set it up to create all day events because I think it makes the Calendar look less cluttered.
Before you can release it into the wild, you need to give your script permission to muck about with your Calendar. Save the script with a useful filename, then click Run -> getLatest...Calendar. During this run, a box will pop up asking to allow permission for the script to change your Calendar, etc. Let it. Then run it again to make sure it's working smoothly. I usually check it by manually changing N1 back to 0 (or one less than the number of unique rows), running the script again, checking that N1 has been changed, then checking the Calendar to see if the entry was created. You should get email notifications if the script fails to run.
The last step is to set the trigger. We want this script to run every time a new row is added (that is, when the Sheet is changed). Click on Resources -> Current project's triggers, or the stopwatch icon. If no triggers have been set, click on "No triggers set up. Click here to add one now.". Make sure "getLatest...Calendar" is selected under Run. Under Event, change "Time-driven" to "From spreadsheet," then choose "On change." Save the script, test it out by tweeting something, and you're now automatically turning your tweets into calendar entries.
So there you have the somewhat involved process of turning tweets into Calendar entries. Please let me know if you have any questions or suggestions -- especially about that nefarious double-trigger issue!
Update 17-03-17: Since originally writing these posts, I've learned more about what query() really does, so I'm updating some references. Part 4 of an going series dealing with taking tweets about homework, sorting them, putting them on the course website, and creating Calendar entries. The story so far...
This (mercifully short) post will talk about how to link data in a parent Sheet to a completely separate Sheet. I need to have a separate Sheet for each course to run my calendar script, but there are any number of reasons you might want to link Sheets instead of just making a copy. If you want to embed only certain columns or tabs in the new Sites or in Classroom, it's easier if you import the data into a new Sheet first. The other reasons all pretty much have to do with the fact that if you make a change to the data in the parent Sheet, the new Sheet will update as well; a copy is not linked and won't update. It's really easy to do. Create a new sheet (I call mine "CourseCode hw to calendar") and copy the following code into cell A1: =query(IMPORTRANGE("1hgVADAoR-TlKYPGawmMCmxaQKZ77lkKpbSdNozjzcCQ","Tweets for MCF3M!U:W")) Importrange() will link to the data in a separate Sheet; it will update when you open the spreadsheet. (Query() lets the spreadsheet update without you having to open it, which is what automating is all about. sort/filter the data and is not strictly necessary here.) You will need to change both the red and the blue text for your Sheet.
The red text is the spreadsheet key of the main sheet, which you get from its url: https://docs.google.com/spreadsheets/d/1hgVADAoR-TlKYPGawmMCmxaQKZ77lkKpbSdNozjzcCQ/edit#gid=652985193
The blue text is the name of the tab you are getting the data from, followed by a ! and the columns you want. In this case, it brings in the columns with the sorted and reverse-dated tweets.
Note: When you're setting up the spreadsheet for the first time, you need to give access to IMPORTRANGE() first.*
Give permission, and wait for your new sheet to populate...
Once permission has been granted, you'll have a nice Sheet you can embed (or run a script on) with no worries. Any changes to the linked cells in the parent Sheet will automatically update in this one.
The final installment of this series will talk about the script to create calendar entries from this data.
*At the beginning of the year, for each sheet I set up importing from the main one, I needed to copy the importrange part into another cell of the spreadsheet, click on the red error triangle, allow access, then delete that cell. When I was trying to grab screenshots for this post, new sheets already seemed to have access to the main one, which was a nice surprise. It looks like my setup time for new courses will be slightly reduced!
In this post I'll show you how to create the code to create a link to a webpage of (or embed) Sheets* data and talk about some things you have to watch out for. The 'Publish to the Web' feature is the other thing** that makes not just Sheets, but all of the GAFE tools supremely useful. I use it for lots of things, including self-grading quizzes and drill sheets, but I'll talk about it in the context of embedding my sorted homework tweets on the course webpage.
Update 17-03-17: You could probably do a lot of this with something like Awesome Tables, but if you're a noodler like me, you might do it this way.
Something to note: publishing to the web lets anyone who can visit your webpage (or who has the link) see your data; it makes a copy of the sheet and that's what is published. Any permissions you had on the original Sheet won't be copied over, and people might be able to see the underlying data for charts.
First, decide whether you want to create a web page, PDF, or a spreadsheet format, or if you want to embed the Sheet/tab*** in an existing webpage. Embedding a sheet looks like the screenshot above. Publishing it as a separate webpage looks like this:
Here's how to do it. I'll talk about creating a link first, since embedding means a bit more work if you have columns to hide.
If you want to link to only part of a tab or more than one of the tabs (but fewer than all) in a sheet, you have to hide everything you don't want seen. Highlight any columns you want to hide (in the case of the homework tweets, that would be columns A-T), click on the triangle in the column header, and select "hide column." If you want to share multiple (but not all) tabs, click on the triangle on the tabs you want hidden and select "hide sheet." Bear in mind that if you unhide anything, it will be visible on the web until you hide it again. I also take the time to get rid of the gridlines to keep it looking uncluttered.
Once you've taken care of that, you're ready to publish. Click on File->Publish to web.
The default choice is to create a link to a web page, but you can also create a PDF.
The "automatically republish when changes are made" should be checked -- unchecking it creates a static page that won't update.
If you only want to publish one tab at a time, select it from the list. If you want to publish more than one tab in the same page, select "Entire document."
I've been playing around with this a bit, and if you select several tabs from the lower menu, it will only publish one tab at a time. It looks like if you want to publish each tab separately, you have to close the 'publishing' pop-up and reopen it, choosing a separate tab to publish (getting an entirely new link). You would need to check off each tab you want to publish from the lower menu. However, I might be wrong and it might stop publishing the previous tabs. (I should say that I import my columns U-W into an entirely new Sheet for each course because of the calendar script, so I don't have to worry about hiding columns and I have only ever published one tab at a time from any given sheet.)
Here's what it looks like if you publish more than one tab at the same time using "Entire document." The user can click the links at the top to visit the different courses.
In the above example, I tried choosing to publish only the first four tabs, but it published the last one anyway. I hid Sheet1 and another tab, and as you can see they didn't get published. Hide what you don't want others to see, because the selection defaults to only one tab or the entire (viewable) document.
Any time you change the original Sheet, the webpage (or PDF, etc.) will also update. If at any time you want to stop publishing the Sheet, go to the publishing tab and click "Stop publishing" at the bottom. That way even if someone still has a link, they'll get a "We're sorry; that page is not published" error message.
Embedding a Sheet works the same way for the most part, except that you get html <iframe> code that you add to your site or blogpost. The main difference is, because you're embedding a copy of the Sheet, it will publish every column, including any you have hidden. To fix this, you need to either a) bring only the desired information into a new tab or Sheet and embed that (this is what I do) or b) manually add code to limit the range you embed. This post from hellotumo.com explains how to do that.
You will need to manually add width and height codes since the default is pretty small. I add width="90%" but keep the height the same since I only want the most recent homework tweets to be visible; users can scroll down to see older tweets. The code will look something like this:
Below is what happens if you embed a sheet (with multiply tabs) and try to hide columns.
I did hide columns A-T in the original sheet, but embed doesn't care. It does care that I hid a few tabs, which is nice of it.
In my next post, I`ll talk about how to import data from one Sheet to another. The final post will deal with the script to create a Calendar entry.
*If you are using Sites or Classroom, embedding the Sheet is easy; however I recommend importing the relevant information (such as the formula for column U) into a new Sheet since there doesn't seem to be a way to embed only one tab without hiding the rest and it won't let you hide the other columns. Here's hoping that the new Sites gives us an html code widget soon.
**The query() function being the best thing, of course. Oh, and that collaboration business.
***Again, by "tabs" I mean the different "sheets" within any one "Sheet," because that's just confusing.


")


