When I did my physics honours specialist with John Caranci way back when, he told us that one of the easiest ways to become a great teacher is to try or adopt one new technique per month. Well, I'm still working on that (I probably average 3-4 a year), but this year I'm going to really make the effort to try them several times per month.
I've already made the first change by getting the students used to grouped tables -- a bit challenging in one of my classrooms which has fixed benches, but I'm trying to make it work -- and I started my October technique a bit early because I couldn't wait.
I was inspired by this blog post by Sara Van Der Werf to try a Stand and Talk with my grade 11 mixed math students last week. To summarize, the old-style "share with your neighbour/elbow-partner/TPS" doesn't really work most of the time. Sara has found that getting the students to stand up and walk across the room to talk to another person and giving each pair a paper with something to look at with the instruction "notice 10/20/50 things about this" really increases student engagement. Her post is excellent, with specific instructions on how to make it successful and a lot of math examples to use.
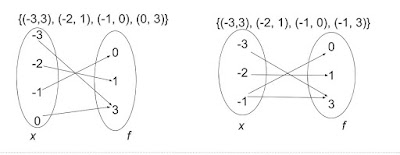
I thought mapping diagrams would be a good place to try this. We'd looked at domain and range and function/NAF. I prepared this picture for them to look at and notice at least 10 things (yes, it's supposed to be a big number).
Did it work? Mostly. I wound up grabbing the wrong folder and left the students' copies of the diagrams in my office, but I did put them up on the screen. Not ideal, because on my original version the arrow heads were not as obvious and I used too small a font for the sets of points and the labels, so they were a bit hard to read from the back of the room. There was a bit of "I don't know what she wants, do you know what she wants?" at the beginning, but after I encouraged them to go for the obvious first and used Sara's prompts ("I should see you pointing," "What do you wonder?" "Everything on the screen is there for a reason. What else to you notice?"), I heard some good discussions. And once we were talking as a class, I had volunteered suggestions right away instead of the usual silence.
Some of the suggestions:
*I did my math honours specialist final project on concept attainment, and I keep meaning to work it into lessons whenever I can. Perhaps I'll do a blog post about it so I will remember to use it.
(By the way, the link to the "rumors" group learning routine at the end of Sara's blog post would be great for the prediction part of POE or for review.)
 |
| This is my revised version |
Some of the suggestions:
- there are circles on the page
- there are numbers in the circles
- the numbers go from negative to positive in both of the left circles
- there are no negative numbers in the right circles
- the numbers go in order
- there are 4 numbers in one left circle and 3 in the other
- both right circles have 3 numbers
I was a bit surprised that nobody mentioned the arrows, but that could be because the arrow heads wee small and didn't really register, but when I pointed out that there were arrows, more suggestions came in thick and fast:
- an arrow goes from the -3 to the 3
- another arrow goes from the -2 to the 1 (etc)
- two arrows go to the 3 in both right circles
- there are two arrows going from the -1 in one circle, but all the rest have only one arrow
Nobody noticed the connection to the coordinate pairs above the diagrams, but I think that is because the font was too small and they didn't really notice it. Once I asked "do you see a -3 anywhere else on the page?" the penny dropped.
- Oh! The arrow goes from -3 to 3, and there's a -3 and 3 together above.
- Same with the -2 and 1.
- That first circle is all the first numbers and the second is all the second numbers
We stood the whole time we did this, and nobody complained. This was very surprising to me because there are a few students in that class who complain as a matter of principle, but who were actually mostly engaged in the activity and even offered a suggestion or two.
So will I be using stand and talks again? You bet. I'm already scheming my next picture. I love the way I could work concept attainment* into the notice and wonder. I need to make I also focus on the "what do you wonder" questions. The diagrams do require a bit of thought first, so I'm aiming to do two per month in my math classes to begin with and work up to once a week in all classes. I'm already planning on trying this as a way to introduce B-R diagrams, chemical formulas, and circuit diagrams later on in grade 9 science; and more immediately, rational vs irrational numbers, polynomials, like vs unlike terms in grade 9 math; standing waves in physics; and different forms of the quadratic function in the mixed math. That will do to start with, I think!
*I did my math honours specialist final project on concept attainment, and I keep meaning to work it into lessons whenever I can. Perhaps I'll do a blog post about it so I will remember to use it.