I love this idea. It's like test corrections, but without my having to grade the test first. Because of the nature of the test, the question level should be such that it should be difficult for any one student to get 80% by themselves. Lots of higher-order thinking skills, not so much of the recall.
I was hoping to try this method out with my pre-AP physics class several times this year, but I only got a chance to do it once right at the end in the electromagnetism unit. I opted to go the scratch card route, since coding a trouble-free non-mc group test would take more time and energy than I usually have in May and I also already have a nice bunch of conceptual mc questions (plus some shamelessly pulled from previous OAPT physics contests for extra oomph).
My test was 15 questions long. The students sat around trapezoidal tables in groups of 3-4 more or less based on their (self-chosen) lab groups -- the class is pretty homogeneous so that worked out fairly well grade-wise. I gave them 25 minutes to solve the questions on their own, then put the scratch cards on the tables. I also gave them individual white boards and let them use the blackboards if they wished. [One of my students is mute, and since I didn't let them use their phones, having a personal whiteboard for communicating was crucial.] They had the rest of the period (45 minutes) to redo the test as a group. Difficulty-wise, I tried to err on the side of the test being too easy since it was our first try (and I always tend to think questions are too easy when in reality, not so much).
I have to say, it was a lot of fun to watch. There was cheering. There were groans of agony. Most importantly, there was immediate feedback and learning... and I didn't have to mark it myself. Marks-wise, we went from high 50s to mid-90s, with most marks in the 70s. The marks are a bit lower than this class is used to, but I'm putting that down to it being the last test of the year and having rushed through teaching some of the material. I wound up just adding their individual marks to the group marks and making the whole thing out of 70 (one of the questions was a bit too confusing, so I made it a bonus).
Weirdly, not many of them used the whiteboards. I need to get the students using the whiteboards early and often in class so they are used to thinking things through visually.
I wish I had done this for the post-friction lab quiz. I am thinking that I will adopt this for the multiple-choice sections of future tests; since I'm considering moving to standards-based grading for the calculations/written explanations, I might get the best of both worlds.
On to the slightly more crafty section of the post.
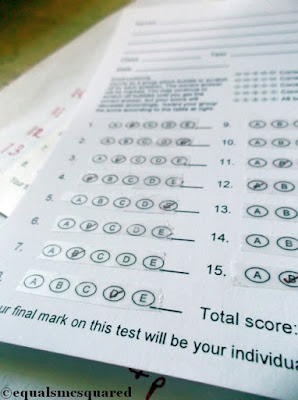
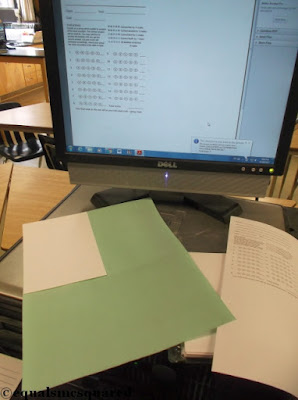
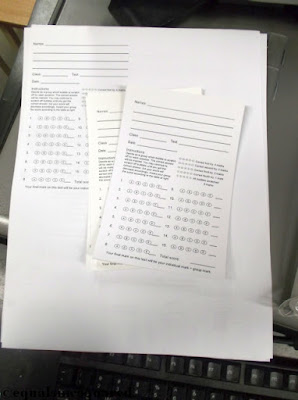
I used 4x6" matte photo cards because I have a huge number of them at home, but you could probably use construction or even regular paper. There is also the online IF-AT test maker, but that is geared towards (very) large groups (minimum 125 cards). To send the cards through the "no, I really only want to print on letter-sized paper and maybe legal if you really insist" school laser printer, I used loops of masking tape to tape the wrong side of the photo card to a scrap piece of letter-sized paper and send it through. Using masking tape is important because it doesn't form an immediate permanent bond like clear tape does; you're less likely to tear the card when you remove it. Painter's tape would be even better for this. I had to experiment to see which side tore less.
Once you've printed your cards and answered them (I used a red checkmark), you make them into scratch cards. How to DIY: some quick Googling brought me to this site. Essentially, you need some clear tape, acrylic paint, dish soap, and a brush.


You tape over the bubbles, then mix 2 parts paint to 1 part dish soap, and apply. Ideally, you'd apply thin coats so you don't get a lumpy paint job, but frankly the bubbles are so small I don't think it matters. I started by using gold paint but it was taking too long to become opaque -- I got up to 5 coats on my tester cards and you could still see through the paint (on both sides if you held it up to the light), although it's possible I originally had too high a ratio of soap to paint. I added a large dollop of grey paint and presto! I only needed 2 coats to cover my bubbles.
You could make a stencil if you wanted to get really finicky and avoid overpainting; I just scraped off the worst of the excess paint where I could.
I also made scratching tools by cutting up an old plastic membership card. The flat edge was pretty much the size of a bubble, so they wouldn't "accidentally" scratch off part of the wrong bubble. The kids loved scratching off the answers; this would be fun to do as a vocabulary lottery card-type thing or a fun take on a homework pass. And it's reusable!
I'm also going to explore doing this as a computer exercise because multiple choice is great for conceptual questions, but a bit of a pain for calculation exercises. I like that in Mazur's version, the group members' answers come up and that's what they discuss. I'm sure Mazur got someone to code specialty software, but I think it could be done with GAFE tools using a combination of Forms, Sheets, my self-grading quiz tutorial, and the FormRanger add-on. The one difficulty I see is getting the students to write exactly what I put in as an answer, and how to let them know that they need to fix a small issue (say, sig figs or direction) as opposed to having completely the wrong answer.
What other ways could we use scratch cards (physical or computer-based) in class?


