Showing posts with label math. Show all posts

Tuesday, 23 March 2021

Join me at OAME 2021, May 17-21


On the left: 20... 21... OAME Toronto. Equity Counts. On the right: Fidgets and Forks: Modelling Periodic Behaviour in Real-Time, Andrea McPhee, Jarvis C.I., TDSB, @Ms_McPhee. OAME/AOEM Annual Conference May 17-21, 2021. OAME2021.ca #OAME2021 #AOEM2021 Presenting on: Thurs., May 20 @ 4 PM

 OAME 2021 is completely virtual this year, and I'm excited to be presenting two sessions. The pre-recorded session will be a version of Rope-a-Slope: Inquiry in Grade 9 Math, updated to work for face-to-face, socially distanced, and virtual learning. Despite being pre-recorded, it will still be asynchronously interactive should you wish to play along at home, and there will be a Google doc to post questions afterwards. The recording will be available Wednesday, May 19 at 1 pm EST until June 11.

The live session is Fidgets and Forks: Modelling Periodic Motion in Real Time for grades 11-12 math. Come and play with fidget spinner data, tuning fork data, heart beats, pendulums, and how to get students to capture their own data. If you can't make the date of Thursday, May 20 at 4 pm EST (or any of the other live sessions), the session will be recorded and the recording will be available until June 11.

Register now! (Or check with your principal to see if your school has a group code.)

On the left: 20... 21... OAME Toronto. Equity Counts. On the right: Rope-a-Slope: Inquiry in Grade 9 Math, Andrea McPhee, Jarvis C.I., TDSB, @Ms_McPhee. OAME/AOEM Annual Conference May 17-21, 2021. OAME2021.ca #OAME2021 #AOEM2021 Prerecorded. Available: Wed., May 19

Tuesday, 29 December 2020

Final assessment ideas: Physics/Science BINGO!

A 6x6 bingo board with 23 grade 12 physics topics listed; there are 7 green boxes indicating choice of unit and 6 blue "Choose a science topic not listed" boxes.

(I've put my resources and a link to Mike Mohammed's bingo assessments at the bottom of this post if you want to skip over the discussion.)

When we went to emergency remote learning last spring, our science department elected not to do a formal "exam". Since we were required to provide some kind of summative assessment opportunity, I was really happy I had come across this BINGO video idea from Kevin McChesney of @TigerPhysics earlier in the year.

I had been planning to adapt it for last year's summative project anyway, but it was perfect for lockdown science once I tweaked it a bit to make it work for our situation: all assessments were optional, and because we are a full-year school (as opposed to semestered), we were only allowed to give a total of 1.5 hours of work a week per course.

They had to choose a row or column, or one of the two diagonals (for the physics only) and create a video/slide-show/portfolio/study guide/something showing how well they understood the topics in that row, column, or diagonal. The more connections they made to things they had learned, the better! (For example, if the topic was Normal Force, I wanted them to talk about how it related to other "topics" such as the force of gravity, the force of friction, Newton's laws of motion, kinetics, etc.) They could hand in different topics at different times, and each topic could use a different medium.

The Rules
  • no more than 2 items in each row/column may use material that is not their own work
  • if they are using someone else’s video, they may not also use the audio
  • each video must have material from each of the 4/5 units
  • for the pale green box(es), they include a topic of their own choosing from the missing unit; subject to my approval. They were given lists of suggested topics.
  • the blue squares are a free topic: they may choose any other topic as long as it is something that was covered in class; subject to my approval
Additional requirements for physics:
  • at least three topics must include discussion of how they would find a mathematical prediction; all topics must discuss conceptual understanding
  • there must be at least one practical demo
and for grade 9 science:
  • Experimental design: they pick a topic from a list, which includes possible independent and dependent variables. They design an experiment to test the effects of changing one variable on another. They don’t need to perform the lab, but they will write it up as if they had, and set up a data table and graph for the results.
I wanted to keep it as PITA-free as I could for them, especially since some students had been having difficulties uploading the weekly videos to Flipgrid. I asked them to submit a rough draft or outline at least a week before the final due date so I could give feedback using Screencastify, and I made that part of the final mark so they would actually hand in a draft. (By the way, I'm going to blog about how much I loved making video comments on student drafts; you should absolutely try it.)

I started from TigerPhysics's grid and just made changes to reflect our curriculum. I took out the projects because the time restriction meant building/making anything was probably unrealistic, even if they could do it without leaving their homes. The green option boxes came about as I figured out which unit was missing from that row/column/diagonal. Of course, I've since realized that this is just a Sudoku board and could have saved myself some grief, but I kind of liked that it gave additional choice within a constraint. 

A 6x6 bingo board with 23 grade 11 physics topics listed; there are 7 green boxes indicating choice of unit and 6 blue "Choose a science topic not listed" boxes.


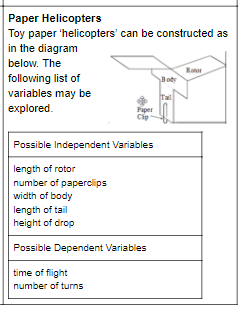
Grade 9 science only has 4 units, but we wanted them to do a lab design since it was something we had been focussing on all year. Although they didn't have to do the lab, we picked experiments they could do at home if they had the equipment: paper helicopters, soap suds, bouncing balls, etc., with suggested independent and dependent variables. (These are experiments we ask them to design during the in-school lab exam, so fortunately that wasn't any extra work.)

A 6x6 bingo board with 23 grade 9 science topics listed; there are 6 green "lab design" and 6 blue "Choose a science topic not listed" boxes. One box says "Choose a science topic from Ecosystems or Space"Paper Helicopters. List of possible independent and dependent variables.


There's some doubled and missing units in a few lines, again because I just started from Kevin's grid. For future use I've rejigged the unit distribution for 4/5/6 units and 4 units + lab design/build (which is just 5 units with some colour formatting) (so "unit" can be any grouping of content you wish, or a build/lab design/drawing/whatever you need). Each includes a free-choice box. If you want to make your own or need a different-sized board, dCode.xyz is the Sudoku-maker I used. Type 'Sudoku' into the search bar and choose your size. Click "Fill" and type single letters or digits in to represent the topic group (no spaces to get them lined up across the top of the board). Remember to tick the "Mode Sudoku X" box if you want the diagonals, choose one of the nifty shapes if you want to give the students even more choice, and click "Solve Sudoku". (Également, il est disponible en francais.)


I loved this project. I got some amazing things out of the students -- granted, they were the students who were still participating in the great online experiment of Spring 2020, but I'm definitely going to be doing it in the future. I particularly want to incorporate Mike Mohammed of @Mo_Physics's idea of using Bingo choice boards for student end-of-unit review; that way they have a base of video footage they can either revise or reuse at the end of the year. I also liked that in a course with different sections, where different teachers may have focussed on different topics to different degrees (no matter what we plan), each teacher could swap out a topic or two and still maintain the integrity of the assessment across classes.

Here's an example from a grade 11 student about Normal Forces (with a wee bit of possible miscommunication about N3, the normal force, and the force of gravity), posted with permission. The student chose to do their math in other topics, alas. For reference, in Ontario grade 11 physics deals primarily with 1D forces; we leave the math of inclined planes to grade 12. (The slides precede the video, which has no sound.)


(Newton is making a repeat appearance from the student's Newton's law video. And you bet I make them cite where they get their meme graphics from!)

Future thoughts: adding a build requirement to the project (or choice of build/lab design for physics), decreasing the amount of "other people's work" the senior grades are allowed to include, including 1-1 conferencing check-ins, working out how to do something similar for math courses, optional working with a partner on certain segments...

Resources: McPhee's Summative Bingo planner and emergency remote learning Assessments

Summative Choice Board planner

Grade 11 physics (SPH3U) remote learning summative assessment


Thursday, 25 April 2019


I will be presenting two micro sessions at Unleashing Learning today: Getting Started with Math Techbook from 1:25- 1:45 and Formative Assessment with Plickers from 2:05 - 2:25, both at Table 1. 

Come join me!


Monday, 16 October 2017

Google Camp and Renewing Math Summit are coming...


There are some fantastic PD opportunities coming up in the next few weeks.

Google Camp 5.0 will be on November 4; sadly it has already sold out, but you can put your name on the waiting list and some of the sessions will be simulcast on Twitter. I'm thrilled to be joining some amazing speakers; I'll be presenting a follow-up session to my Flipping Your Classroom session from March -- I'm going to try modelling a flipped lesson! There will be pre-session homework (if you so choose)! I'm very excited to be talking about EquatIO and Desmos, which are two really amazing ways to take math and STEM digital. As usual during the day there will be a room with helpful helpers available if you've been running into difficulties with GAFE and need someone to walk you through the solution.

More info will be available soon at http://bit.ly/tdsbcamp


The TDSB's Renewing Math Summit on the Friday, December 1 PD day is offered to secondary teachers. The focus is on Teaching/Leading in an Equitable Classroom and 21st Century Global Competencies. I'll be giving a session called Rope-a-Slope: Inquiry in Grade 9 Math where a simple piece of rope and a measuring tape and guided inquiry can lead to learning about relationships between variables, slope, direct and indirect variation, and more. The other sessions look amazing as well -- I'd love to be able to attend them all. There might also be a drop-in room to learn more about digital math tools like Knowledgehook, Desmos, Geogebra, etc. 

Registration for TDSB secondary teachers is on K2L until November 23, or they reach capacity.

Join me!

Saturday, 30 September 2017

Standing and Talking: a first attempt

Note: Google Camp 5.0 will be Saturday, Nov. 4. Registration is open for TDSB teachers on K2L. This event always sells out, so register soon! If you're interested in presenting, submissions are open until Monday, Oct. 2. The TDSB's Renewing Math Summit will be Friday, Dec. 1; you can still submit a proposal until Sept. 30. Yes, that's today. Hurry!

When I did my physics honours specialist with John Caranci way back when, he told us that one of the easiest ways to become a great teacher is to try or adopt one new technique per month. Well, I'm still working on that (I probably average 3-4 a year), but this year I'm going to really make the effort to try them several times per month.

I've already made the first change by getting the students used to grouped tables -- a bit challenging in one of my classrooms which has fixed benches, but I'm trying to make it work -- and I started my October technique a bit early because I couldn't wait.

I was inspired by this blog post by Sara Van Der Werf to try a Stand and Talk with my grade 11 mixed math students last week. To summarize, the old-style "share with your neighbour/elbow-partner/TPS" doesn't really work most of the time. Sara has found that getting the students to stand up and walk across the room to talk to another person and giving each pair a paper with something to look at with the instruction "notice 10/20/50 things about this" really increases student engagement. Her post is excellent, with specific instructions on how to make it successful and a lot of math examples to use.

(By the way, the link to the "rumors" group learning routine at the end of Sara's blog post would be great for the prediction part of POE or for review.)

I thought mapping diagrams would be a good place to try this. We'd looked at domain and range and function/NAF. I prepared this picture for them to look at and notice at least 10 things (yes, it's supposed to be a big number).

mapping diagram of a function/naf
This is my revised version
Did it work? Mostly. I wound up grabbing the wrong folder and left the students' copies of the diagrams in my office, but I did put them up on the screen. Not ideal, because on my original version the arrow heads were not as obvious and I used too small a font for the sets of points and the labels, so they were a bit hard to read from the back of the room. There was a bit of "I don't know what she wants, do you know what she wants?" at the beginning, but after I encouraged them to go for the obvious first and used Sara's prompts ("I should see you pointing," "What do you wonder?" "Everything on the screen is there for a reason. What else to you notice?"),  I heard some good discussions. And once we were talking as a class, I had volunteered suggestions right away instead of the usual silence.

Some of the suggestions:

  • there are circles on the page
  • there are numbers in the circles
  • the numbers go from negative to positive in both of the left circles
  • there are no negative numbers in the right circles
  • the numbers go in order
  • there are 4 numbers in one left circle and 3 in the other
  • both right circles have 3 numbers
I was a bit surprised that nobody mentioned the arrows, but that could be because the arrow heads wee small and didn't really register, but when I pointed out that there were arrows, more suggestions came in thick and fast:
  • an arrow goes from the -3 to the 3
  • another arrow goes from the -2 to the 1 (etc)
  • two arrows go to the 3 in both right circles
  • there are two arrows going from the -1 in one circle, but all the rest have only one arrow
Nobody noticed the connection to the coordinate pairs above the diagrams, but I think that is because the font was too small and they didn't really notice it. Once I asked "do you see a -3 anywhere else on the page?" the penny dropped.
  • Oh! The arrow goes from -3 to 3, and there's a -3 and 3 together above. 
  • Same with the -2 and 1.
  • That first circle is all the first numbers and the second is all the second numbers
At this point I switched to Socratic questioning, and we established that the left circles were the x's, or domain, and the right circles were the y's, or range; none of the numbers were repeated and were in order from most negative to most positive; that one was a function and the other wasn't; and that you could tell whether it was a function or not by the number of arrows coming from each of the points in the domain. I then told them these were called mapping diagrams and had them create some from sets of points.

We stood the whole time we did this, and nobody complained. This was very surprising to me because there are a few students in that class who complain as a matter of principle, but who were actually mostly engaged in the activity and even offered a suggestion or two.

So will I be using stand and talks again? You bet. I'm already scheming my next picture. I love the way I could work concept attainment* into the notice and wonder. I need to make I also focus on the "what do you wonder" questions. The diagrams do require a bit of thought first, so I'm aiming to do two per month in my math classes to begin with and work up to once a week in all classes. I'm already planning on trying this as a way to introduce B-R diagrams, chemical formulas, and circuit diagrams later on in grade 9 science; and more immediately, rational vs irrational numbers, polynomials,  like vs unlike terms in grade 9 math; standing waves in physics; and different forms of the quadratic function in the mixed math. That will do to start with, I think!


*I did my math honours specialist final project on concept attainment, and I keep meaning to work it into lessons whenever I can. Perhaps I'll do a blog post about it so I will remember to use it.


Sunday, 4 June 2017

Updated: Fidget spinner math


Update: I've added a link to the data in Desmos and TI lists below.
Yes, I jumped on board the "if you can't beat 'em, join 'em" boat.

Inspired mostly by Harry O'Malley's site, I brought a fidget spinner* and my phone to grade 11U math class one day and the students modelled the spin. The above graph is the one of my student's results. It's a bit wonky because in the two days since I had bought it, one of the end caps had fallen off, which made the central bearing ring shift off centre. This made it slow down a lot; the above graph shows a few tries at spinning. The student at the top of the post took an average of the cycles while other students just looked at the first.


To make a good video, mark one of the edges of the spinner so you have a reference point to track. The app I used is VidAnalysis Free for Android (for Apple fans, Vernier has an app for LoggerPro that lets you do the same stuff, if not more). Don't spin it too quickly unless you have much better equipment than I do -- I tried to analyse that lovely first video and got goobledeegook because it's spinning too fast for the video to capture properly.

You then pick reference points (known length and origin of coordinate system) and track your mark. You can skip forward and backward in time to get to the section you want to analyse. I goofed because I forgot that I had made a spin without my finger in the way; by the time I remembered, I had already invested too much time getting the other data. Hence the starts and stops.

I didn't want to take up class time getting the analysis ready, so we discussed what equation we were likely to see, and then worked on other problems. Before the next class, I made the analysis and turned the data into graphs in Google Sheets. The next class, I put the x-distance graph up on the screen and got the students to figure out the model. When they had an equation, I graphed it against the data (if you do this, remember that spreadsheets do trig with radians, not degrees).

It was a really good exercise, considering it's the first time I've officially used the VidAnalysis in class. We had some great discussions about the vertical translation (did I deliberately make the coordinate system off-centre? no, but I will next time because that led to interesting math); how to deal with the increasing period; how the amplitude of our function compared with the actual measured distance.


I've since shifted the centre bearings back and made another, better video analysis. The screen shots are below:
What I like about this, mathematically, is a) how it shows the spinner slowing down; b) how it shows that I didn't hold the camera completely still -- notice that the "zero line" of the equation shifts up (nice for composition of functions!); and c) the x- and y-distances are essentially translations of each other (sin vs cos). I could have really expanded on this activity and got them to break the functions into different domains.

The velocities show the same math effects as the distances; this could be used to show that the derivative of sinusoidal functions are still sinusoidal (and how). If only Google Sheets would get their act together and let us connect points in scatter plots.

More screenshots. What I really like is that you can upload the data as a csv file to Drive.
Copy-paste makes it simple to create a spreadsheet.

Note that the Free part of the app means ads. I was still giving it a trial run, but I think I will upgrade to the premium version because it's a great little app.


I started the trig functions section by creating a periodic wave using a salt-shaker pendulum (an idea I cribbed from someone on Twitter -- I can't remember who it was, but I'd love to give her the credit). I now wish we had filmed the pendulum at the same time so we could compare our rough model to the data. Future ideas!

I have a graphing calculator assignment that grabs tuning fork data from a microphone; I get the students to model the function and work backwards to determine the frequency of the fork. We didn't get to it this year, but it would go well with this exercise.

If you'd like to use my data, feel free to make a copy of fidget spinner 2, or download the csv file. I'm going to import this into a Desmos activity and graphing calculator lists at some point; when I do, I'll update this post with links. Update:Here are links to the data in Desmos and as TI lists.

*I meant to use one of the students' spinners in my MCF3M class, but ran into difficulties because that student wasn't in class the day we were supposed to do the model. Since I wanted a permanent mark on the spinner, I decided to not buy trouble and get my own. Plus, they're fun.

I did this exercise with the 11M students as well, but we wound up doing it as a class instead of individually.

Thursday, 2 February 2017

Google Camp is coming...

Google Camp poster: I'm sharing Google Sheets: More than Just Number Crunching and Flipping Your Lessons: Tools and Tips

TDSB Google Camp 4.0 will be Saturday, March 4. At the risk of seeming like a Google Groupie, I love Google Camp; I've learned and been inspired by so much at every session I've attended -- not least during the demo slam at the end. I'm excited and more than a little trepidatious this year to be joining some amazing speakers. During the day, there will be a room with helpful helpers available if you've been running into difficulties with GAFE and need someone to walk you through the solution.

More info will be available soon at http://bit.ly/tdsbcamp, but TDSB teachers can register now through Key To Learn. This will sell out, so act now!

Thursday, 3 November 2016

Happy accidents

I've been teaching for a good while now, but I'm happy to know that there are still things I can learn, because it keeps me sharp. Also? Happy accidents become teachable moments and an exercise for one class turns into several exercises for three different classes.


I'm always on the lookout for "real-world" examples of math and physics that aren't the usual boring cell phone/well bore/cannon ball stuff. I came across this video of the water fountain at Detroit International Airport and was struck by one image that was filled with different parabolas, thanks to the initial velocity of the water and the perspective of the shot. I turned it into an exercise and assignment for my MCR3U where they had to find the equations of two parabolas, and then the equation of three lines, one which was a secant to one parabola, one which was a tangent to the other, and the third was a secant to one and a tangent to the other.

Naturally, I wanted to modify it for use with my MCF3M class. I came up with an exercise where they find the equations of two parabolas: one in root form and one in vertex form. For their assignment, they'll have to turn each equation into the other form algebraically (plus standard form for good measure).

I tried it out three days ago. To help them prep, I got them to pick the axes and a parabola to look at (noting that each water jet is actually two parabolas). We measured the roots and used the y-intercept to find the a value. Pretty straightforward, and I thought determining the vertex form would be a snap.

Except that when we calculated a, we got a completely different number. Not "we're off by a few decimal places" different, but -0.19 vs -1.1 different. These students are still struggling a bit with vertical stretches and compressions, so a discrepancy like that is not on. 

I asked a colleague to verify my calculations, and he figured out that my calculations were fine. The problem was probably that for the parabola the class chose, the y-intercept and vertex were so close together that a=-1.1 was within the accepted error. I used another point far from the vertex and got a=-0.18. Much better.

screenshot of quadratic water sculpture notes

[By the way, we I did also make some heinous measurement and calculation mistakes, but since all mistakes I make are intentional (ahem), this just gives me an opportunity to talk about making sure our values make sense. More happy accidents.]

Unfortunately, I had the DLL PD today, so I wrote this all down on the board and hope they got it during today's class. I'll review on Friday when I next see them. They need to have the equations (and domains and ranges) ready for next Thursday's assignment.

That discrepancy is really interesting. I will have to modify this worksheet to tell the students to make sure their points are not too close together. Plus, I may have accidentally stumbled on a realistic way to teach uncertainty in my grade 11 physics class. A happy accident indeed. I'll keep you posted.


Once I get my act together, I'll create a page where I will share my various worksheets and handouts. For now, check out my course webpages (link up top) under "Handouts and Assignments". My class notes for both (all three?) lessons will be posted under the "Notes" section at the end of the month.