Monday, 6 September 2021

Grading for Equity week 7: Practices That Value Knowledge, Not Environment or Behaviour, cont. (Chapter 10) #Grade4EqChat


Grading for Equity book cover. Text reads "#Grade4EqChat Twitter Book Club Weekly Chat. Mondays @ 8pm EST July 26-Oct 4 1-2 chapters/week 4-6 questions over the hour using Q#/A# format

The Grading for Equity Twitter chat is tonight at 8pm EST, although some West Coasters have been coming in later and taking part somewhat asynchronously -- there are no late penalties in this chat! This week, we will be continuing the discussion of biased grading practices with chapter 10: Practices That Value Knowledge, Not Environment or Behaviour (continued)... aka the Homework chapter. Please feel free to join in the discussion! Here are this week's questions:
  1. What, in your opinion, is the purpose of homework, especially in physics or science classes?
  2. Think about students in your class who routinely do not complete homework. What sorts of things might be stopping students from getting homework done?
  3. How do you count homework in your current grading practices? If a student does not complete homework, what is at stake for them?
  4. Feldman argues that we actually encourage cheating by giving points for homework; b/c students know they'll be penalized for not doing it, copying seems a reasonable strategy. Have you seen this to be true? How can we avoid inadvertently encouraging cheating?
  5. How might we support our vulnerable students - those who need more time to do homework or those who have fewer supports and resources outside the school - and who most need the practice that homework is designed to provide? 
Incidentally, in one of his questions at the end of the chapter, Feldman suggests comparing marks/grades of a class with and without homework and participating categories. I've done something similar to this (with quizzes & looking at different weights for assignments, eg, since I've never "counted" homework or participation), and it can be eye-opening. Highly recommended.

Last week's chat is archived in this Wakelet You can access all the past chats from the resources section. See you tonight!

Monday, 30 August 2021

Grading for Equity week 6: Practices That Value Knowledge, Not Environment or Behavior (Chapter 9) #Grade4EqChat


Grading for Equity book cover. Text reads "#Grade4EqChat Twitter Book Club Weekly Chat. Mondays @ 8pm EST July 26-Oct 4 1-2 chapters/week 4-6 questions over the hour using Q#/A# format"

This week the Grading for Equity Twitter chat (8pm EST) will be examining biased grading practices with chapter 9: Practices That Value Knowledge, Not Environment or Behaviour. Please feel free to join in the discussion! Here are this week's questions:

  1. What sorts of activities do you award extra credit for, if any? If there are things you routinely offer extra credit for, why have you not made those activities required parts of your curriculum?
  2. What is your policy for late work? Do you deduct points? How might you reevaluate your late work policy to give students time to learn and master content?
  3. When students cheat, do they get an automatic zero for a grade? Is this the best punishment for cheating? Are they made to re-do the assignment on their own? What else might work to rehabilitate student learners? 
  4. ”Some consider cheating on an assessment ... as a signal that though she is struggling, she is still engaged and cares about her success.” Do you agree? Could cheating be a sign of greater engagement than if a student simply skipped the assessment?
  5. Which student behaviours do you grade?  How can students be taught how participation and effort are means for learning, not ends in themselves?
Last week's chat is archived here. You can access all the past chats from the resources section. See you tonight!

Monday, 23 August 2021

Grading for Equity week 5: Practices that are Mathematically Accurate continued (Chapter 8) #Grade4EqChat


Grading for Equity book cover. The text says "#Grade4EqChat Twitter Book Club Weekly Chat. Mondays @ 8pm EST July 26-Oct 4. 1-2 chapters/week. 4-6 questions over the hour using Q#/A# format"

This week the Grading for Equity Twitter chat will be digging deeper into chapter 8: Practices that are Mathematically Accurate (continued). Here are the original questions (the twitter versions will be edited somewhat for space):

  1. Do give students a grade “bump” when they have shown improvement or growth over a term? By allowing (and encouraging) students to demonstrate growth over time through improved performance, and recording that most recent performance, do we still need to include a bump, or does the improved score itself recognize and reward growth?
  2. How easy should it be for a student to be able to calculate her own grade? Does the traditional “average” method allow for this? Would standards-based-grading allow for this? 
  3. In physics & science, we necessarily do a lot of group work (e.g. labs, presentations, etc.) What is your current strategy for group grades? Does it align with the Grading for Equity pillars? If not, how could you make it do so? 
  4. Think of an example in the professional workplace in which group work (or more likely, called “collaboration”) is expected. What is the rationale, and how is the effectiveness of that collaboration determined? How could we apply this to grading? 
  5. What are your main takeaways from the past two chapters on mathematically accurate grading practices? What changes so far, if any, will you make to your grading system? 

Last week's chat is archived here. You can access all the past chats from the resources section. See you tonight!

Monday, 16 August 2021

Grading for Equity week 4: Practices that are Mathematically Accurate (Chapter 7) #Grade4EqChat

Grading for Equity book cover. The text says "#Grade4EqChat Twitter Book Club Weekly Chat. Mondays @ 8pm EST July 26-Oct 4. 1-2 chapters/week. 4-6 questions over the hour using Q#/A# format"

This week in the Grading for Equity Twitter chat, we are finally digging in to the meat of the book. We'll slow down a bit; fewer questions and only one chapter per week.

This week, we are looking at chapter 7: Practices that are Mathematically Accurate.

  1. What grading scale do you currently use? What are your thoughts about it now that you’ve read this chapter?
  2. If you’ve assigned a zero, was it intended primarily to affect students mathematically or psychologically? Knowing that it is mathematically unsound and demotivating as well as inaccurate, does that change your opinion of it?
  3. Did you have any particular light bulb moments while reading this chapter?
  4. What other ideas in this chapter would you like to discuss? Do you have any concerns?

Last week's chat is archived here. You can access all the past chats from the resources section. See you tonight!

Monday, 9 August 2021

Grading for Equity week 3: The Case for Change (Chapters 5 & 6) #Grade4EqChat


The book cover of Grading for Equity, and the text #Grade4EqChat, Mondays @ 8 pm EST July 26-Oct 4; 1-2 chapters/week; 4-6 questions over the hour using Q#/A# format

The Grading for Equity Twitter bookclub continues apace. Last week we studied chapters 3 &4, which introduced us to the problems in our current grading schemes. 


This week we will be looking at chapters 5 & 6, continuing with The Case for Change and A New Vision for Grading. Feel free to join in, even if you haven't read the book! Here are the questions:

  1.  Are students motivated to achieve success or to avoid failure? What specific actions, policies, or words by teachers cause students to experience one type of motivation instead of the other?
  2. Do you think of your tasks at work as performance or mastery goals? What affects how you define the goal? How does this affect how you pursue the task?
  3. In what ways do schools and classrooms send a message of competition for achievement?
    How does your school's treatment of awards and honors promote or undermine a growth or fixed mindset?
  4. Review your classroom's current grading policies through the pillars of our vision: How accurate are they? How bias-resistant? How motivating?
  5. How much does this book's vision for equitable grading match against your school's overall vision? How likely is it that your school community could agree on this vision?
  6. How much does this book's vision for equitable grading align with your own, personal vision for grading? What concerns do you have about this vision? What are your hopes?

See you then!


Monday, 2 August 2021

Grading for Equity week 2: The Case for Change (Chapters 3 & 4) #Grade4EqChat


The book cover of Grading for Equity, and the text #Grade4EqChat, Mondays @ 8 pm EST July 26-Oct 4; 1-2 chapters/week; 4-6 questions over the hour using Q#/A# format

Last week's Twitter chat went really well. Please join in, even if you haven't read the book or aren't a physics teacher! I've archived the tweets, and you will always be able to find them on my Resources page.

We had a great discussion about some of our philosophy and current grading practices.


One big takeaway: No more grading homework!

This week we will be looking at Chapters 3 & 4, which focus on why we should be changing our grading practices. Here are the questions we'll be answering:

  1. Thinking about how others have responded to your mistakes: How have helpful responses impacted you and your effectiveness? How have unhelpful responses impacted you and your effectiveness?
  2. Recall something you learned to do outside of the school context. What motivated you to learn and to continue learning when you struggled? 
  3. How effective are the use of points for students who are the least motivated and engaged? How might the use of points—the addition and subtraction throughout a student's day—affect those students' relationships with adults and their self-concept about whether school is “for” them?
  4. What confidence or uncertainty do you have that two teachers in your school would assign the same grade to a student?
  5. Are there teachers with reputations as “hard” or “easy” graders? What, specifically, defines them as that? How does this categorization make you feel? How does it make that teacher feel? How do students react?
See you tonight! The rest of the schedule is posted at this tweet.

Monday, 26 July 2021

Grading for Equity TwitterChat Mondays 8-9pm EST #Grade4EqChat


Front cover of Grading for Equity by Joe Feldman
Several of the physics PD sessions I've attended this summer have mentioned Grading for Equity by Joe Feldman, and how much we'd like to have a discussion about it. So, in the interest of pushing myself well outside my comfort zone, I'm hosting a weekly Twitter chat. It will no doubt have a physics education slant to it, but all educators are welcome to participate, even if you haven't read the book.

The chat will be on Mondays from 8-9 pm EST until October 4. The current plan is to look at 2 chapters per week to begin with, moving to 1 chapter per week for part III. We'll use the questions at the end of each chapter as a starting point for discussion. 

I'll post, from my Twitter profile, a new question about every 10-15 minutes or so. We use the Q# / A# format. Remember to include #Grade4EqChat somewhere in your tweet so others will find it.

TDSB teachers can access the book and in print through the Virtual Library. For Ontario teachers, it is available online through the OCT library. For teachers elsewhere, check and see if it is available through your board or district or professional organization.


The schedule will be

Tuesday, 23 March 2021

Join me at OAME 2021, May 17-21


On the left: 20... 21... OAME Toronto. Equity Counts. On the right: Fidgets and Forks: Modelling Periodic Behaviour in Real-Time, Andrea McPhee, Jarvis C.I., TDSB, @Ms_McPhee. OAME/AOEM Annual Conference May 17-21, 2021. OAME2021.ca #OAME2021 #AOEM2021 Presenting on: Thurs., May 20 @ 4 PM

 OAME 2021 is completely virtual this year, and I'm excited to be presenting two sessions. The pre-recorded session will be a version of Rope-a-Slope: Inquiry in Grade 9 Math, updated to work for face-to-face, socially distanced, and virtual learning. Despite being pre-recorded, it will still be asynchronously interactive should you wish to play along at home, and there will be a Google doc to post questions afterwards. The recording will be available Wednesday, May 19 at 1 pm EST until June 11.

The live session is Fidgets and Forks: Modelling Periodic Motion in Real Time for grades 11-12 math. Come and play with fidget spinner data, tuning fork data, heart beats, pendulums, and how to get students to capture their own data. If you can't make the date of Thursday, May 20 at 4 pm EST (or any of the other live sessions), the session will be recorded and the recording will be available until June 11.

Register now! (Or check with your principal to see if your school has a group code.)

On the left: 20... 21... OAME Toronto. Equity Counts. On the right: Rope-a-Slope: Inquiry in Grade 9 Math, Andrea McPhee, Jarvis C.I., TDSB, @Ms_McPhee. OAME/AOEM Annual Conference May 17-21, 2021. OAME2021.ca #OAME2021 #AOEM2021 Prerecorded. Available: Wed., May 19

Tuesday, 29 December 2020

Final assessment ideas: Physics/Science BINGO!

A 6x6 bingo board with 23 grade 12 physics topics listed; there are 7 green boxes indicating choice of unit and 6 blue "Choose a science topic not listed" boxes.

(I've put my resources and a link to Mike Mohammed's bingo assessments at the bottom of this post if you want to skip over the discussion.)

When we went to emergency remote learning last spring, our science department elected not to do a formal "exam". Since we were required to provide some kind of summative assessment opportunity, I was really happy I had come across this BINGO video idea from Kevin McChesney of @TigerPhysics earlier in the year.

I had been planning to adapt it for last year's summative project anyway, but it was perfect for lockdown science once I tweaked it a bit to make it work for our situation: all assessments were optional, and because we are a full-year school (as opposed to semestered), we were only allowed to give a total of 1.5 hours of work a week per course.

They had to choose a row or column, or one of the two diagonals (for the physics only) and create a video/slide-show/portfolio/study guide/something showing how well they understood the topics in that row, column, or diagonal. The more connections they made to things they had learned, the better! (For example, if the topic was Normal Force, I wanted them to talk about how it related to other "topics" such as the force of gravity, the force of friction, Newton's laws of motion, kinetics, etc.) They could hand in different topics at different times, and each topic could use a different medium.

The Rules
  • no more than 2 items in each row/column may use material that is not their own work
  • if they are using someone else’s video, they may not also use the audio
  • each video must have material from each of the 4/5 units
  • for the pale green box(es), they include a topic of their own choosing from the missing unit; subject to my approval. They were given lists of suggested topics.
  • the blue squares are a free topic: they may choose any other topic as long as it is something that was covered in class; subject to my approval
Additional requirements for physics:
  • at least three topics must include discussion of how they would find a mathematical prediction; all topics must discuss conceptual understanding
  • there must be at least one practical demo
and for grade 9 science:
  • Experimental design: they pick a topic from a list, which includes possible independent and dependent variables. They design an experiment to test the effects of changing one variable on another. They don’t need to perform the lab, but they will write it up as if they had, and set up a data table and graph for the results.
I wanted to keep it as PITA-free as I could for them, especially since some students had been having difficulties uploading the weekly videos to Flipgrid. I asked them to submit a rough draft or outline at least a week before the final due date so I could give feedback using Screencastify, and I made that part of the final mark so they would actually hand in a draft. (By the way, I'm going to blog about how much I loved making video comments on student drafts; you should absolutely try it.)

I started from TigerPhysics's grid and just made changes to reflect our curriculum. I took out the projects because the time restriction meant building/making anything was probably unrealistic, even if they could do it without leaving their homes. The green option boxes came about as I figured out which unit was missing from that row/column/diagonal. Of course, I've since realized that this is just a Sudoku board and could have saved myself some grief, but I kind of liked that it gave additional choice within a constraint. 

A 6x6 bingo board with 23 grade 11 physics topics listed; there are 7 green boxes indicating choice of unit and 6 blue "Choose a science topic not listed" boxes.


Grade 9 science only has 4 units, but we wanted them to do a lab design since it was something we had been focussing on all year. Although they didn't have to do the lab, we picked experiments they could do at home if they had the equipment: paper helicopters, soap suds, bouncing balls, etc., with suggested independent and dependent variables. (These are experiments we ask them to design during the in-school lab exam, so fortunately that wasn't any extra work.)

A 6x6 bingo board with 23 grade 9 science topics listed; there are 6 green "lab design" and 6 blue "Choose a science topic not listed" boxes. One box says "Choose a science topic from Ecosystems or Space"Paper Helicopters. List of possible independent and dependent variables.


There's some doubled and missing units in a few lines, again because I just started from Kevin's grid. For future use I've rejigged the unit distribution for 4/5/6 units and 4 units + lab design/build (which is just 5 units with some colour formatting) (so "unit" can be any grouping of content you wish, or a build/lab design/drawing/whatever you need). Each includes a free-choice box. If you want to make your own or need a different-sized board, dCode.xyz is the Sudoku-maker I used. Type 'Sudoku' into the search bar and choose your size. Click "Fill" and type single letters or digits in to represent the topic group (no spaces to get them lined up across the top of the board). Remember to tick the "Mode Sudoku X" box if you want the diagonals, choose one of the nifty shapes if you want to give the students even more choice, and click "Solve Sudoku". (Également, il est disponible en francais.)


I loved this project. I got some amazing things out of the students -- granted, they were the students who were still participating in the great online experiment of Spring 2020, but I'm definitely going to be doing it in the future. I particularly want to incorporate Mike Mohammed of @Mo_Physics's idea of using Bingo choice boards for student end-of-unit review; that way they have a base of video footage they can either revise or reuse at the end of the year. I also liked that in a course with different sections, where different teachers may have focussed on different topics to different degrees (no matter what we plan), each teacher could swap out a topic or two and still maintain the integrity of the assessment across classes.

Here's an example from a grade 11 student about Normal Forces (with a wee bit of possible miscommunication about N3, the normal force, and the force of gravity), posted with permission. The student chose to do their math in other topics, alas. For reference, in Ontario grade 11 physics deals primarily with 1D forces; we leave the math of inclined planes to grade 12. (The slides precede the video, which has no sound.)


(Newton is making a repeat appearance from the student's Newton's law video. And you bet I make them cite where they get their meme graphics from!)

Future thoughts: adding a build requirement to the project (or choice of build/lab design for physics), decreasing the amount of "other people's work" the senior grades are allowed to include, including 1-1 conferencing check-ins, working out how to do something similar for math courses, optional working with a partner on certain segments...

Resources: McPhee's Summative Bingo planner and emergency remote learning Assessments

Summative Choice Board planner

Grade 11 physics (SPH3U) remote learning summative assessment


Friday, 25 December 2020

New urls, who dis?

Just a very quick note to say that I've moved this blog url from equalsmcsquared.blogspot.com to andreamcphee.blogspot.com, and also my course webpage became http://mcpheesics.ca last January. I think all my links here are updated, but let me know if I there's anything I didn't catch.

I'm also for real planning to blog more regularly for the next few months; I have no excuse since I'm on leave and a whole pile of posts still in draft. I've got a post queued up for Monday already.

ETA: Make that Tuesday. Oops! On the other hand, it allows me to post this gif I've been using a lot these past few months...


Monday, 13 July 2020

PD with a cat in your lap

If there is one positive thing that has come from this pandemic and the sudden switch to everything virtual, it's that there is a literal world of online PD available out there, and you can roll out of bed and attend it in your pjs. With a cat on your lap or not, as it happens.

Currently it seems like all the PD is happening at the same time. This week, in fact.
A screenshot of my Google Calendar. Almost all the spots are filled with some kind of online PD.
That's four conferences in one week. I'm going to be busy!

This current spate of PD (or CPD as some call it) actually started this past Saturday with the Seneca Virtual Science Conference. Seneca is a free UK homework and revision platform, and they have been offering free, short but packed conferences in all subjects, as well as pd for online teaching and free courses for teachers in things like metacognition, literacy, etc. You can check out the recorded science webinar and presentation resources at the link above. 

And yes, I had to get up at 3:45 am to attend. But it was over by breakfast time!

They are also hosting some post-conference Twitter chats this week at 7:30 pm BST. #senecaCPD


Three of the virtual conferences focus on tech or general pedagogy; scroll down if you're just interested in physics.

FlipTech2020 logo

The free FlipTech 2020 conference actually started yesterday and continues until Thursday. What I'm liking about this conference is that they are actually flipping it. You can hop in at any point; watch the videos/presentations before hand, then join the speakers for a live Q&A Zoom. The Zoom meetings are being recorded, so you can catch up if you miss something. Follow #FlipTech2020 for details and updates.

ISTE Summer Learning Academy July 13-31, 2020


ISTE is hosting a 3-week Summer Learning Academy starting today until the end of July, although you will be able to access the materials until October. It's only $US 20 (more if you want the yearly membership which gives you access to more courses). This academy is specifically focussed on online learning, which seems somewhat appropriate these days. There are daily webinars and 4 microcourses which you can work on at any time -- convenient if you happen to have filled up your schedule with other online PD! The schedule is here.

United EdTech Conference logo

I'm really pleased to be attending the 2020 United EdTech Conference this Friday and Saturday, which will be elevating BIPOC voices and examining best pedagogical practices for using edtech. The days will be short and sweet, with a 90-minute Pedagogy in Practice session followed by a 30-minute Lunch and Learn session. The webinars will be recorded and made available, which is great since there are too many good options and we can only pick one each day. Fortunately, some of the lunch and learn sessions will be repeated on day 2. The $US 10 fee will be donated to The Learning Laboratory New Orleans.

Yes, the FOMO is real.


IOP and TalkPhysics logo

I've been following the UK Institute of Physics for a while, envious of all the teacher PD they provide. They've had to move a lot of their PD online and it's been fantastic. Attending the South Region 3-day event at the beginning of July meant more 3:30 wake-up calls, but it was worth it. (And let's face it: rolling out of bed, making a cup of tea, and getting to the presentation in 15 minutes is a practice I don't really mind repeating.) I've been attending scattered workshops as well, and am on the lookout for the next Power of Per workshop since I couldn't attend last Thursday. The North West region is having their 3 days starting this Thursday until Saturday.

As for how to attend more than one workshop at once? Even with an extra Chromebook, that might be a bit much, but I'll figure it out.
A sma;; grey cat is seen from behind, staring at a laptop screen on which there is a Zoom meeting.


Thursday, 25 April 2019


I will be presenting two micro sessions at Unleashing Learning today: Getting Started with Math Techbook from 1:25- 1:45 and Formative Assessment with Plickers from 2:05 - 2:25, both at Table 1. 

Come join me!


Thursday, 10 January 2019

Assignment Submission Forms

Did you miss the Ditch Textbook Summit last month? Matt Miller has reopened access to all 35 videos from January 10 to 18. There's some great stuff there, including downloadable notes and certificates of completion. Click here to sign up. If you miss it, you'll have to wait until next December.

I gave a (slightly overlong) webinar to a group of TDSB teachers about Google Drive in December, and one of the things I mentioned is that the "Shared With Me" folder is.... well, it can be a bit of a mess. Mine is, at any rate, and last year I was finding it more and more challenging to find and then systematically open any documents students shared with me, especially since I told them to deselect the "Notify me" option when sharing. I told the webinar group I would blog about how I use Forms and a Sheet to make my life easier.

Very simply: when students write up an assignment (using Docs, Sheets, Slides, etc.), they share the link with me (making sure I have edit access so I can view their revision history and make comments). I've put the link to the form on the course webpage, and also in the body of the assignments.


I have the settings set to collect their email addresses (which in the TDSB includes their first and last names), so I don't bother asking for that separately.  I have a drop-down menu which is populated using the formRanger add-on for the assignment name, but you can just keep adding to it in the form itself. Then all they need to do is copy the link for their document. I set up response validation to "url" so that I get a clickable link in the response spreadsheet. I only have one section of each of these courses this year, so I've deleted that question from my forms to keep it simple.


Under Presentation, I select "Show link to submit another response", and I always write a personal confirmation message. For this form, it is "Thanks! Your assignment has been submitted to Ms. McPhee. You can continue to make changes to it until the due date." I've got some students who want to submit the url at the beginning of the assignment and some who prefer to wait until they're finished, and this works for both.


Under Responses, I select the response destination to be a spreadsheet. I've got all my submission forms going to the same spreadsheet so I only have to go to one sheet, but you can make a separate sheet for each form if you like. 


In the response spreadsheet, I created a new tab called "Marked?" and use the query function to bring the data into the new tab: in A1, put

=query('Form responses 1'!A1:E)

I then add a new column called Marked? at the end, and use Insert Tick Boxes to populate the cells with tick boxes.

If you want to sort into different sheets by section or even by assignment, then create a tab for each one and then use the following query in A1 of each tab:

=query('Form responses 1'!A1:E,"Select * where C = 'section-code-here'",1)

or

=query('Form responses 1'!A1:E,"Select * where D = 'assignment-name'",1)


where 'section-code-here'/'assignment-name' matches one of the values in your section or assignment questions. Here is a video explaining how to sort form responses using Query if you want to get fancy. (Warning: the tick boxes will be static, so if you reorder the rows or do some filtering by date or section or what-have-you, the boxes will stay ticked or unticked and won't move with the rest of the row.)

When I mark the assignments, I just click on the link to open their document. I usually have a spreadsheet rubric open in a side-by-side window, so it's easy for me to go back and forth, and it's really easy for me to tick off that I have marked an assignment and open the next student's. I can also add little comments to myself on each assignment in the cells to the right of the tick boxes.

I know Google Classroom is set up to not need all this, but I've only started using Google Classroom properly with one class this year, and I'm not loving the way they do assignments from my end. It could be because I'm not as familiar with how it works yet, but I think my solution works better for me. YMMV.

My next step is to set up a link to this in my assignment tracker sheets so it will automatically show whether they have submitted an assignment.

Note: you could have them submit Word documents, Excel spreadsheets, pdfs, jpgs, etc the same way, except that instead of a short-answer question, choose File upload. The files will get uploaded to a subfolder in the Drive containing this form, and you'll get a link to the file in the spreadsheet as before.

Here is a copy of a sample assignment submission form (including a file upload question, which I don't actually use) and the associated response spreadsheet, which is also where formRanger finds the assignment names.

Let me know if you have any questions or comments.


Monday, 3 December 2018

How to make a (quasi) box plot in Google Sheets

Want PD? TDSB Teachers should sign up for the TEL workshops on K2L. I'm presenting Getting More out of Drive as a webinar December 13, and there are plenty more workshops on offer. For everyone else, the Ditch That Textbook Summit is back. Free webinars! I will eventually blog about what I got out of last year's summit. Which was a lot. And Kyle Pearce and Jon Orr, the guys behind Make Math Moments that Matter, are having a Winter Holiday Giveaway! Win a spot in the MakeMathMoments online workshop, Wipebook packs,  their favourite books, ZorbitsMath licenses, Knowledgehook Store Credit!

I'm teaching MDM4U (Data Management), MAP4C (Grade 12 College), and MBF3C (Grade 11 College Math) this year (as well as three other courses, which perhaps explains the lack of posting). They all deal with, in one form or another, statistics. We're mostly using Fathom in MDM4U but for the other two courses I want to get them using Sheets, since they are more likely to see spreadsheets in the future than a proprietary statistical software.

One of the big downsides to stats in Sheets is the lack of box plots. Sadly, the apparently amazing Statistics add-on is not supported anymore, so we're stuck with what Sheets provides to us. Candlestick chart, which are intended for stock prices and graph low-open-close-high, could be used, but they are only vertical and don't include the median. You also need to put the data in horizontally, which I find counterintuitive.

minimumQ1Q3maximum
height B (cm)150168.5181198
height A (cm)137151.75174.75194

They do give you a quick overview of the spread, if that is all you want.

There is a way to get something more box-and-whiskerish, and it's error bars to the rescue again. Here, we use a stacked bar chart:

It is by no means perfect, since the 1st quarter whisker is doubled (and as you can see sometimes goes past the box into the 4th quarter) and the 4th quarter whisker is reduced to a mere tick at the maximum value, but I think it does very nicely. I'm actually thinking it might be a better way to teach box plots, since there's a bit of prep to do beforehand that might make students pay attention to what it means. I haven't coded for outliers yet, and I think that will be less straightforward to include. Also, I don't think this will work at all if you have any negative values.

I am a little worried that some of my students will be confused by that extraneous right whisker in plot B, but we'll see.

To plot the data, you need to add an additional column per plot, like so:
          J            K           L          M          N           O
    1ABAB
    2Minimum137150Minimum137150
    3Q1151.75168Q114.7518
    4Median164175Median12.257
    5Q3174.75182Q310.757
    6Maximum194198Maximum19.2516

The italicised numbers on the left are the what you would expect to plot on a box plot. The bolded values on the right N1:O6 are what you will actually plot. They are just differences between the points; J3 is just Q1 - Minimum for group A, and so on:


You can put in as many box plots as Sheets will allow, but you should keep the difference data, which is what you will plot, all together to make it easier on yourself.

Highlight the range of data Choose Insert -> Chart, then under Chart Type choose Stacked bar chart (Stacked column will give you a vertical box plot, if you like). Change the Stacking to "Standard" and select "Switch rows/columns". If you have labels for different plots in the first row, select "Use row 1 as labels".


Then click on CUSTOMIZE and choose Series. Here is where you will use the error bar and colour magic to make this thing look a bit more like a box plot.

The first box will be 0 to the minimum filled in. Choose "no colour" to make it disappear.
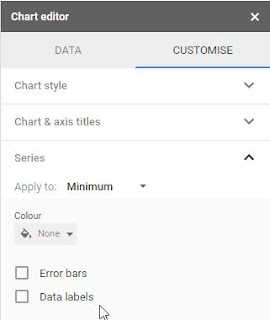


The second box, Q1, should be coloured a really pale colour. I use pale yellow. Select Error bars, make sure the Type is Percentage, and set the Value to 100. This will give you a whisker that goes all the way to the minimum value on the left (and Q1 + min on the right, unfortunately.)


You can leave the next two boxes (Median and Q3) as they are, or you can play around with colour choices. Keep them different colours so you can tell the difference between the 2nd and 3rd quarters, and I'd avoid choosing colours that are too dark because that extra whisker stands out too much.


Lastly, set the last box Maximum to the same pale colour you used for Q1. Select Error bar, keep the Type as Percentage, and set Value to 0. Sadly, if you choose 100 you'll get a right-hand error bar that goes beyond the maximum, which I think would be too confusing.


Note: this would be even better in Excel, which allows you to choose left or right error bars.

Next, you can turn the legend off, set the minimum value to be something a bit more in line with your data, and add some extra vertical gridlines if you like.

So there you go: quasi-box plots in Sheets. Let me know if you find this useful or have any suggestions for making it even better.


(This is what it looks like if you put 100% error bars in the Maximum box. Not worth the confusion, in my opinion.)


Saturday, 27 October 2018

Upcoming (Really Soon!): Google Camp 6.0

Google Camp promotional poster

TDSB Google Camp 6.0 is next Saturday. It's sold out, naturally, but if you are lucky enough to go, I'll be presenting three sessions in room 218.

Session 1 is an updated and expanded version of Taking Math Digital with Desmos, Geogebra, and Equatio. Come explore tools that can make investigation in math, science, and STEM easy and fun. The Desmos graphing calculator, in particular the activity builder and activities such as Card Sort, Polygraph, and Marbleslides, is a valuable tool that makes helping students explore math concepts easy and interactive. Geogebra is a GSuite and user-friendly version of Geometer's Sketchpad. We will also talk about the updates to the Chrome extension EquatIO, helps write your math using predictive text, handwriting, and speech input, not to mention integration across all GSuite platforms.

Update: John McGowan, the creator of EquatIO, will be doing a Global Math webinar this coming Tuesday to talk about Digital Math Flow with EquatIO, Desmos, and Google. How timely!

In session 2, I will be giving an updated version of Flipping the Learning. This session will show you what a flipped lesson looks like, and how I am currently integrating flipped lessons into my math and physics classes. We will discuss the pros and cons, how it can be used for differentiated learning, and how to increase buy-in. In addition, we will discuss the technical aspects of flipping, specifically the specialized flipping platform EDpuzzle (but you can keep it as simple as YouTube and Google Forms). If you watch the video ahead of time, you will get the opportunity to delve deeper into some of the nifty features of EdPuzzle and have your first curated video ready for Monday's class!

In session 4, I'll be presenting How Random! Infinite Possibilities Using Sheets, which will talk about how to make the randomized practice sheets that are my pride and joy.  Sheets is useful for so much more than just accounting and graphs! Learn how the random number functions can be used to automagically create vocabulary lists, math problems, matching exercises, and yes, graphs... the possibilities are quite literally endless. Want to create a random question of the day? Sheets! Want the answer key, too? Sheets! Even better, you can link them to other GSuite products such as Docs, Slides, or Drawings to make collaboration easy. Sample templates will be provided so you can have a finished product ready to go for Monday's class.

It'll be a busy day, with lots of great workshops to choose from. If you can't make it to one of mine, I'll put links to the resources.

Hope to see you there!


Friday, 14 September 2018

Upcoming: STAO 2018

I'm excited to be presenting at STAO this year. I'll be giving an updated version of my OAPT talk: Beyond the Traditional Lab: Tips and Tweaks for Critical Thinking. It will have a definite physics slant, but the ideas can be applied to all sciences.

The talk will be on Thursday, November 8 at 3:30 pm. You can register for the conference at www.stao.org.


Saturday, 12 May 2018

OAPT Conference overview and sundry nifty physics things I've been working on


I'm writing this on the train back from the OAPT conference hosted at the University of Western Ontario, and it was, of course, amazing. I have so many thoughts and new great ideas to put into practice. Some quick takeaways: 
  • thinking about using improv techniques in class to overcome my (and students') implicit bias, especially "Yes, and?"
  • "We use mathematics to help us make the physics more precise."
  • "Just because I don't have a 'math brain' doesn't mean I don't have something useful to contribute."
  • "You're not part of a group, you're part of a team."
  • Yes, the students do really need to draw a picture
  • Why haven't we been using the rotunda at Jarvis to make super-long pendula?
Also, this happened:
I think I'm going to have to wait until June to do the write-up justice.  I will share my presentation on Tweaking the Traditional Lab below; a link to various files and resources is posted in the resources section of this blog.


(Incidentally, one of the things I always like to mention when I'm introducing myself at presentations is how amazing the PD is on Twitter. The chart on the first slide is a perfect example. Elizabeth Houwen (a math teacher, incidentally) posted it last June, and I thought it would be a great way to get the students to practice unit conversions as well as estimation, and we also got a nice little lab out of it and an anchor chart so they have "reasonable" speeds to compare their answers to. All from one small tweet!)

***

I've been busy converting my drill sheets practice sheets, which I mentioned in my last post) into Google sheets, as well as creating new ones. I'm fairly proud of the chemical nomenclature one (in part because I just found out how to write superscript and subscript numbers in Sheets, so the clunky ^3 _4 notation is mostly gone), but I really want to share the electromagnetic right-hand rules ones.

I made these using the =image() function, which allows you to put an image directly into a cell (and not just overlay the image on top). Unfortunately, you can't use the shared url of images on your Google drive (which is odd and annoying).

I'll probably refine the mixed version so that it's a little more clear what you need to find in each question; I'm not sure a student would recognize immediately that they need to find the direction of the action of the magnet for 1 and the location of the north pole for 6.

1st half of right hand rules practice sheet

2nd half of right hand rules practice sheet

You can find these and a lot more randomized practice sheets at my course website; click on the practice sheets link under Resources.

Incidentally, sometime between last December and April, Google changed the formatting of "publish to pdf" for Sheets so that it's landscape instead of portrait. There doesn't seem to be a way to modify this, and it's really mucked up my formatting. Everything is spread over two pages, and don't get me started about what it did to my spectroscopy sheets.

Please let me know if you find these useful!