Monday, 3 December 2018

How to make a (quasi) box plot in Google Sheets

Want PD? TDSB Teachers should sign up for the TEL workshops on K2L. I'm presenting Getting More out of Drive as a webinar December 13, and there are plenty more workshops on offer. For everyone else, the Ditch That Textbook Summit is back. Free webinars! I will eventually blog about what I got out of last year's summit. Which was a lot. And Kyle Pearce and Jon Orr, the guys behind Make Math Moments that Matter, are having a Winter Holiday Giveaway! Win a spot in the MakeMathMoments online workshop, Wipebook packs,  their favourite books, ZorbitsMath licenses, Knowledgehook Store Credit!

I'm teaching MDM4U (Data Management), MAP4C (Grade 12 College), and MBF3C (Grade 11 College Math) this year (as well as three other courses, which perhaps explains the lack of posting). They all deal with, in one form or another, statistics. We're mostly using Fathom in MDM4U but for the other two courses I want to get them using Sheets, since they are more likely to see spreadsheets in the future than a proprietary statistical software.

One of the big downsides to stats in Sheets is the lack of box plots. Sadly, the apparently amazing Statistics add-on is not supported anymore, so we're stuck with what Sheets provides to us. Candlestick chart, which are intended for stock prices and graph low-open-close-high, could be used, but they are only vertical and don't include the median. You also need to put the data in horizontally, which I find counterintuitive.

minimumQ1Q3maximum
height B (cm)150168.5181198
height A (cm)137151.75174.75194

They do give you a quick overview of the spread, if that is all you want.

There is a way to get something more box-and-whiskerish, and it's error bars to the rescue again. Here, we use a stacked bar chart:

It is by no means perfect, since the 1st quarter whisker is doubled (and as you can see sometimes goes past the box into the 4th quarter) and the 4th quarter whisker is reduced to a mere tick at the maximum value, but I think it does very nicely. I'm actually thinking it might be a better way to teach box plots, since there's a bit of prep to do beforehand that might make students pay attention to what it means. I haven't coded for outliers yet, and I think that will be less straightforward to include. Also, I don't think this will work at all if you have any negative values.

I am a little worried that some of my students will be confused by that extraneous right whisker in plot B, but we'll see.

To plot the data, you need to add an additional column per plot, like so:
          J            K           L          M          N           O
    1ABAB
    2Minimum137150Minimum137150
    3Q1151.75168Q114.7518
    4Median164175Median12.257
    5Q3174.75182Q310.757
    6Maximum194198Maximum19.2516

The italicised numbers on the left are the what you would expect to plot on a box plot. The bolded values on the right N1:O6 are what you will actually plot. They are just differences between the points; J3 is just Q1 - Minimum for group A, and so on:


You can put in as many box plots as Sheets will allow, but you should keep the difference data, which is what you will plot, all together to make it easier on yourself.

Highlight the range of data Choose Insert -> Chart, then under Chart Type choose Stacked bar chart (Stacked column will give you a vertical box plot, if you like). Change the Stacking to "Standard" and select "Switch rows/columns". If you have labels for different plots in the first row, select "Use row 1 as labels".


Then click on CUSTOMIZE and choose Series. Here is where you will use the error bar and colour magic to make this thing look a bit more like a box plot.

The first box will be 0 to the minimum filled in. Choose "no colour" to make it disappear.


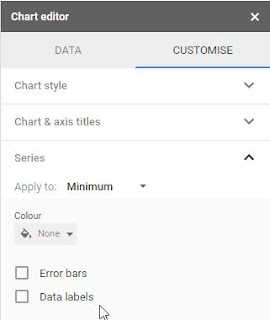
The second box, Q1, should be coloured a really pale colour. I use pale yellow. Select Error bars, make sure the Type is Percentage, and set the Value to 100. This will give you a whisker that goes all the way to the minimum value on the left (and Q1 + min on the right, unfortunately.)


You can leave the next two boxes (Median and Q3) as they are, or you can play around with colour choices. Keep them different colours so you can tell the difference between the 2nd and 3rd quarters, and I'd avoid choosing colours that are too dark because that extra whisker stands out too much.


Lastly, set the last box Maximum to the same pale colour you used for Q1. Select Error bar, keep the Type as Percentage, and set Value to 0. Sadly, if you choose 100 you'll get a right-hand error bar that goes beyond the maximum, which I think would be too confusing.


Note: this would be even better in Excel, which allows you to choose left or right error bars.

Next, you can turn the legend off, set the minimum value to be something a bit more in line with your data, and add some extra vertical gridlines if you like.

So there you go: quasi-box plots in Sheets. Let me know if you find this useful or have any suggestions for making it even better.


(This is what it looks like if you put 100% error bars in the Maximum box. Not worth the confusion, in my opinion.)


Saturday, 27 October 2018

Upcoming (Really Soon!): Google Camp 6.0

Google Camp promotional poster

TDSB Google Camp 6.0 is next Saturday. It's sold out, naturally, but if you are lucky enough to go, I'll be presenting three sessions in room 218.

Session 1 is an updated and expanded version of Taking Math Digital with Desmos, Geogebra, and Equatio. Come explore tools that can make investigation in math, science, and STEM easy and fun. The Desmos graphing calculator, in particular the activity builder and activities such as Card Sort, Polygraph, and Marbleslides, is a valuable tool that makes helping students explore math concepts easy and interactive. Geogebra is a GSuite and user-friendly version of Geometer's Sketchpad. We will also talk about the updates to the Chrome extension EquatIO, helps write your math using predictive text, handwriting, and speech input, not to mention integration across all GSuite platforms.

Update: John McGowan, the creator of EquatIO, will be doing a Global Math webinar this coming Tuesday to talk about Digital Math Flow with EquatIO, Desmos, and Google. How timely!

In session 2, I will be giving an updated version of Flipping the Learning. This session will show you what a flipped lesson looks like, and how I am currently integrating flipped lessons into my math and physics classes. We will discuss the pros and cons, how it can be used for differentiated learning, and how to increase buy-in. In addition, we will discuss the technical aspects of flipping, specifically the specialized flipping platform EDpuzzle (but you can keep it as simple as YouTube and Google Forms). If you watch the video ahead of time, you will get the opportunity to delve deeper into some of the nifty features of EdPuzzle and have your first curated video ready for Monday's class!

In session 4, I'll be presenting How Random! Infinite Possibilities Using Sheets, which will talk about how to make the randomized practice sheets that are my pride and joy.  Sheets is useful for so much more than just accounting and graphs! Learn how the random number functions can be used to automagically create vocabulary lists, math problems, matching exercises, and yes, graphs... the possibilities are quite literally endless. Want to create a random question of the day? Sheets! Want the answer key, too? Sheets! Even better, you can link them to other GSuite products such as Docs, Slides, or Drawings to make collaboration easy. Sample templates will be provided so you can have a finished product ready to go for Monday's class.

It'll be a busy day, with lots of great workshops to choose from. If you can't make it to one of mine, I'll put links to the resources.

Hope to see you there!


Friday, 14 September 2018

Upcoming: STAO 2018

I'm excited to be presenting at STAO this year. I'll be giving an updated version of my OAPT talk: Beyond the Traditional Lab: Tips and Tweaks for Critical Thinking. It will have a definite physics slant, but the ideas can be applied to all sciences.

The talk will be on Thursday, November 8 at 3:30 pm. You can register for the conference at www.stao.org.


Saturday, 12 May 2018

OAPT Conference overview and sundry nifty physics things I've been working on


I'm writing this on the train back from the OAPT conference hosted at the University of Western Ontario, and it was, of course, amazing. I have so many thoughts and new great ideas to put into practice. Some quick takeaways: 
  • thinking about using improv techniques in class to overcome my (and students') implicit bias, especially "Yes, and?"
  • "We use mathematics to help us make the physics more precise."
  • "Just because I don't have a 'math brain' doesn't mean I don't have something useful to contribute."
  • "You're not part of a group, you're part of a team."
  • Yes, the students do really need to draw a picture
  • Why haven't we been using the rotunda at Jarvis to make super-long pendula?
Also, this happened:
I think I'm going to have to wait until June to do the write-up justice.  I will share my presentation on Tweaking the Traditional Lab below; a link to various files and resources is posted in the resources section of this blog.


(Incidentally, one of the things I always like to mention when I'm introducing myself at presentations is how amazing the PD is on Twitter. The chart on the first slide is a perfect example. Elizabeth Houwen (a math teacher, incidentally) posted it last June, and I thought it would be a great way to get the students to practice unit conversions as well as estimation, and we also got a nice little lab out of it and an anchor chart so they have "reasonable" speeds to compare their answers to. All from one small tweet!)

***

I've been busy converting my drill sheets practice sheets, which I mentioned in my last post) into Google sheets, as well as creating new ones. I'm fairly proud of the chemical nomenclature one (in part because I just found out how to write superscript and subscript numbers in Sheets, so the clunky ^3 _4 notation is mostly gone), but I really want to share the electromagnetic right-hand rules ones.

I made these using the =image() function, which allows you to put an image directly into a cell (and not just overlay the image on top). Unfortunately, you can't use the shared url of images on your Google drive (which is odd and annoying).

I'll probably refine the mixed version so that it's a little more clear what you need to find in each question; I'm not sure a student would recognize immediately that they need to find the direction of the action of the magnet for 1 and the location of the north pole for 6.

1st half of right hand rules practice sheet

2nd half of right hand rules practice sheet

You can find these and a lot more randomized practice sheets at my course website; click on the practice sheets link under Resources.

Incidentally, sometime between last December and April, Google changed the formatting of "publish to pdf" for Sheets so that it's landscape instead of portrait. There doesn't seem to be a way to modify this, and it's really mucked up my formatting. Everything is spread over two pages, and don't get me started about what it did to my spectroscopy sheets.

Please let me know if you find these useful!

Tuesday, 19 December 2017

Need spectrography and HR diagram drill sheets? Here you go!

In ongoing PD news, you can still register for the Ditch That Textbook Digital Summit; 9 videos, 9 days. The videos will be available until Dec. 31. Follow the fun at #ditchsummit on Twitter.

I'm still trying to put together my blogs for the fall PD I've been doing, but for now I wanted to share a few things I'm really excited that I figured out how to do.

Inspired by Robert Prior many years ago, I started coding a lot of Excel spreadsheets as randomized drill sheets on many topics. My goal for this year is to get most of them up as Google Sheets so I can publish them to the web and students can go straight to my website to print out an infinite number of sheets.

Anyway, I've also been working on adding new, richer sheets to my catalogue. In particular, I was very jazzed last year when I figured out how to get a spreadsheet to draw spectrographs (hint: error bars). And last night I spent far too long working on how to get a Hertzsprung-Russel diagram (yay for the Bubble chart, boo for the fact that the labels are arbitrarily hidden when you go to a larger font).

Behold, I give you my Spectrograph and HR diagram drills for the grade 9 space unit (and Earth and Space science, too).
jpg of spectroscopy drill sheet; click link for other sheets.jpg of HR diagram drill sheet; click link to see the pdf versions

I'm still working on the HR diagram answers; I have to figure out how best to get it to choose whether it's on the main sequence or not. Also, I think I need more white dwarf stars, because that area is looking pretty sparse.

However:
gif of Liz Lemon high-fiving herself

 If you'd like to see my other drill sheets, head on over to the drill sheet section of my course webpage. It's very much a work in progress. I have a lot more sheets than I've listed there.

Sunday, 10 December 2017

How large is the proton? York University Wednesday Dec. 6

I have completely fallen down on my plan to blog at least once biweekly. I'm going to catch up on blogging all the PD I've been doing though, and I'm going to try to get them done before the break.Consider it a pre-holiday present.

For TDSB teachers, make sure to sign up for the Technology-Enabled Learning sessions (aka the after school workshops) on K2L. For LN24, there are a number of sessions you can still attend this and next month.  Note the change to the Virtual Library session. Sign up now!


Wednesday night I attended York U's open-house night for high school physics teachers. hosted by the Physics and Astronomy Department. It's a great evening of PD, not just because they serve dinner with wine, but also it's a chance to learn about some of the ground-breaking research taking place right now. The topic this year was "How large is the proton?  ̶   the proton size puzzle".

During dinner, there were three 15-minute talks, which is an excellent length. The first was from Dr. Randy Lewis. He talked about how my previous 3-quark understanding of the proton (seen below in the basic Wikipedia image)...
basic 3-quark + gluon image of proton from Wikipedia
By Arpad Horvath (Own work) [CC BY-SA 2.5 (https://creativecommons.org/licenses/by-sa/2.5)], via Wikimedia Commons
...is incomplete; the masses of the three quarks make up less than 1% of the mass of the proton. In reality, at least as far as we currently understand, what we have is much more complicated: at any given time, uncountable pairs of quarks and anti-quarks are appearing and disappearing (along with the associated gluons), and the whole thing somehow makes sure that three valence quarks are always unpaired, as in the picture below, grabbed from phys.org

slightly more correct model of the proton
The blue circle isn't really there. As with everything, protons are mostly empty space. The green circles represent quarks, the orange antiquarks, and the springs are gluons.

Because of this hurricane of energy, current theoretical attempts to calculate the size of the proton aren't there yet, so we need to turn to experiment (the subject of the next two talks).

Dr. Eric Hessels firstly blew our minds by telling us that because of this  –            We can determine the size using atoms – but atoms with electrons and atoms with muons give different answers.
Dr. Marko Horbatsch –    Maybe scattering electrons off of protons can determine the size – but maybe it can’t.

Monday, 16 October 2017

Google Camp and Renewing Math Summit are coming...


There are some fantastic PD opportunities coming up in the next few weeks.

Google Camp 5.0 will be on November 4; sadly it has already sold out, but you can put your name on the waiting list and some of the sessions will be simulcast on Twitter. I'm thrilled to be joining some amazing speakers; I'll be presenting a follow-up session to my Flipping Your Classroom session from March -- I'm going to try modelling a flipped lesson! There will be pre-session homework (if you so choose)! I'm very excited to be talking about EquatIO and Desmos, which are two really amazing ways to take math and STEM digital. As usual during the day there will be a room with helpful helpers available if you've been running into difficulties with GAFE and need someone to walk you through the solution.

More info will be available soon at http://bit.ly/tdsbcamp


The TDSB's Renewing Math Summit on the Friday, December 1 PD day is offered to secondary teachers. The focus is on Teaching/Leading in an Equitable Classroom and 21st Century Global Competencies. I'll be giving a session called Rope-a-Slope: Inquiry in Grade 9 Math where a simple piece of rope and a measuring tape and guided inquiry can lead to learning about relationships between variables, slope, direct and indirect variation, and more. The other sessions look amazing as well -- I'd love to be able to attend them all. There might also be a drop-in room to learn more about digital math tools like Knowledgehook, Desmos, Geogebra, etc. 

Registration for TDSB secondary teachers is on K2L until November 23, or they reach capacity.

Join me!